SAN DIEGO BAY NATIVE OYSTER RESTORATION PLAN - - PowerPoint PPT Presentation

san diego bay native oyster restoration plan technical
SMART_READER_LITE
LIVE PREVIEW

SAN DIEGO BAY NATIVE OYSTER RESTORATION PLAN - - PowerPoint PPT Presentation

SAN DIEGO BAY NATIVE OYSTER RESTORATION PLAN Technical Advisory Meeting December 19, 2013 Meeting Agenda 9:30 9:45 Project Introduction 9:45


slide-1
SLIDE 1

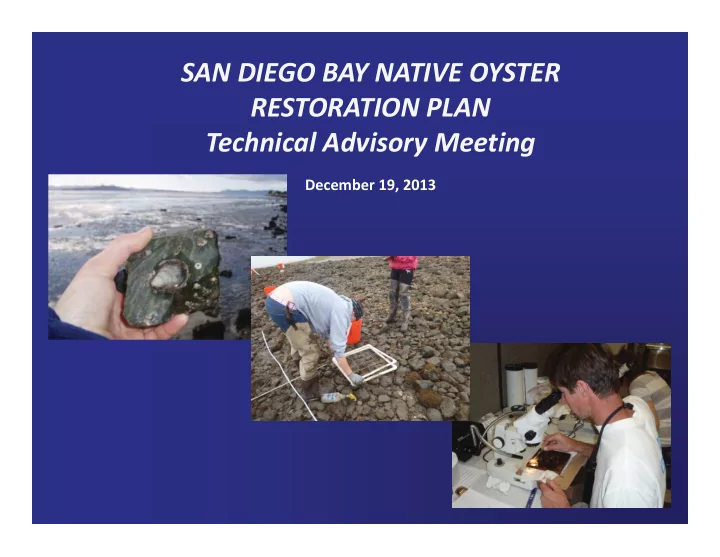
SANDIEGOBAYNATIVEOYSTER RESTORATIONPLAN TechnicalAdvisoryMeeting

December19,2013

slide-2
SLIDE 2

MeetingAgenda

  • 9:30– 9:45

ProjectIntroduction

  • 9:45 10:15

ExistingData– Physical ConditionsandOysterPresenceandDistribution

  • 10:1510:45

OysterSettlementandGrowth

  • 10:45– 11:15

OysterDistribution

  • 11:15– 11:30

PhysicalData WaveEnergy

  • 11:30– 12:30

IdentifyPreferredPotentialSites andAdditionalDataNeeds

  • 12:30– 12:45

Wrapup

slide-3
SLIDE 3

ProjectTeamandPartners

  • SanDiegoUnifiedPortDistrict
  • CaliforniaCoastalConservancy
  • NOAA
  • SouthwestWetlandsInterpretiveAssociation(SWIA)
  • U.S.FishandWildlifeService– CoastalProgram
  • CaliforniaStateUniversityFullerton
  • ESAPWA
  • MerkelandAssociates
slide-4
SLIDE 4

ProjectGoal

  • CreateabiologicallyrichnativeoysterbedinSanDiego

Bayaspartofacompletemarshsystem,whichrestores anecologicalnichethatwashistoricallypresent,is ecologicallyfunctionalandresilienttochanging environmentalconditions,andalsoprotectsbay tidelandsandshoreline.

slide-5
SLIDE 5

ProjectObjectives

1. EvaluateexistingandhistoricaldistributionofoystersintheBay. 2. Determinesuitablelocationsforoysterbedrestoration,using existingandnewdata. 3. IdentifyappropriateenergyenvironmentsandsitesintheBaythat couldmostbenefit(intermsoferosioncontrolandecological function)fromoysterbedcreation. 4. Useapilotscaleapproachtoestablishdemonstrationoysterbeds. 5. Determinetheextenttowhichoysterreefsenhancehabitatfor invertebrates,fish,andbirds,relativetoareaslackingstructureand relativetoprerestorationconditions. 6. Evaluatethepotentialforoysterbedstoreducewaterflow velocities,attenuatewaves,reduceerosion,andpromotesediment capture.

slide-6
SLIDE 6

Task TaskTitle EstimatedCompletionDates 1 PreliminaryStudies

  • 1. LiteratureReview
  • 2. OysterStudies
  • 3. PhysicalStudies
  • 1. December31,2013
  • 2. November31,2013
  • 3. August16,2013

2 ConceptualDesign

  • 1. Identifypotentialrestorationsites
  • 2. Investigatepotentialrestorationsites
  • 3. Selectrestorationsites
  • 4. DraftConceptualdesign
  • 1. October1,2013
  • 2. February1,2014
  • 3. March1,2014
  • 4. May1,2014

3 ProjectPlan

  • 1. DraftProjectPlan
  • 2. FinalProjectPlan
  • 1. May1,2014
  • 2. July1,2014

4 MeetingsandPresentations Monthlyorasneeded 5 ProjectManagement Atleastquarterly

Schedule

slide-7
SLIDE 7

DataCollectionApproach

  • Whatinformationhavewecollected?

– Existingphysicaldata(bathymetry,shorelinesubstrate) – Habitattypes – Occurrenceofnativeandnonnativeoysters – Oystersettlementandgrowth – Waveenergies

slide-8
SLIDE 8

PhysicalStudies– EXISTINGDATA

  • Collect existing GIS data for San Diego Bay

– Bathymetry – Habitats – Shoreline Structures – Ownership and Management Entities – Sediment – Water quality – Wind and wind waves

slide-9
SLIDE 9

Bathymetry

slide-10
SLIDE 10

Depth Categories

slide-11
SLIDE 11

Eelgrass and Depth Categories

slide-12
SLIDE 12

Habitats

slide-13
SLIDE 13

Shoreline Substrate

slide-14
SLIDE 14

Sea Level Rise Risk

slide-15
SLIDE 15

Management Entities and Stakeholders

slide-16
SLIDE 16

OysterDistributionStudies

  • What is known about historic presence of oysters in

San Diego Bay?

  • What is the current distribution of oysters in San

Diego Bay?

  • What is the distributional relationship between

native and non-native oysters?

slide-17
SLIDE 17

OysterDistributionStudies METHODS

  • Literature Review
  • Qualitative: Bay-wide oyster presence survey

– Oysters of both species classified as high, medium or low density

slide-18
SLIDE 18

Historic presence in San Diego Bay

  • SDMNHhasextensive“Ostrealurida”

collectionsfromSanDiegoBayatleast asfarbackasPleistocene

  • Pliocenecollectionsincludeother
  • ysterspeciescollectedinSanDiego

butwhosecurrentdistributionsarein theSeaofCortez

  • Difficulttofindquantitativedataor

evenmentionof“beds”butpresence notedinmultiplepublisheddocuments fromIngersoll(1881)onward

  • Example:IngersollmentionsthatatLa

Puntaonthesouthside,thereare sufficientnumbersofoystersof sufficientsizetohavecommercial importance(butcopperyflavornoted)

slide-19
SLIDE 19

HistoricPresence

Pleistocene(11,0002.5 mya) 2000 1881 20052007

slide-20
SLIDE 20

Oyster Distribution Studies RESULTS

  • Qualitative
  • Densities are

relative to each

  • ther
  • Native and non-

native oysters co-occur at most locations

  • Species display

zonation

slide-21
SLIDE 21

Oyster Distribution Studies RESULTS

  • Low relative
  • density. Just a

few non-native

  • ysters are
  • bserved.
slide-22
SLIDE 22

Oyster Distribution Studies RESULTS

  • Medium relative

densities

  • Zonation

apparent

slide-23
SLIDE 23

Oyster Distribution Studies RESULTS

  • High relative

densities of non- native oysters

slide-24
SLIDE 24

OysterZonation– SanDiegoBay

slide-25
SLIDE 25

OysterZonation– AlamitosBayandHuntingtonHarbor

slide-26
SLIDE 26

OysterZonation– AlamitosBayandHuntingtonHarbor

slide-27
SLIDE 27

ExistingPhysicalDataandOysterPresence– PreliminaryConclusions

  • Overall, San Diego Bay transitions from deep

waters with armored shoreline to shallow waters without armoring.

  • The majority of unarmored shoreline, intertidal

habitat and marshlands occur south of Coronado Bridge.

  • Historically, native oysters have occurred in the bay

for millions of years.

  • Native and non-native oysters currently occur

throughout the bay.

  • Oyster species display zonation.
slide-28
SLIDE 28

OysterSettlementandGrowthStudies

  • Do native oysters settle onto and grow on

new substrate in San Diego Bay?

  • What is the peak season/time for

settlement?

  • At what rate does settlement occur?
  • What is the growth rate of settled oysters?
  • Do non-native oysters and other non-

native species also settle onto new substrate?

  • How do results compare to another

southern California wetland?

slide-29
SLIDE 29

D Street Signature Park J Street Chula Vista Pond 1 1 Grand Caribe

slide-30
SLIDE 30

D Street

slide-31
SLIDE 31

Signature Park

slide-32
SLIDE 32

J Street

slide-33
SLIDE 33

Chula Vista

slide-34
SLIDE 34

Pond 1 1

NORTH SOUTH

slide-35
SLIDE 35

Grand Caribe

slide-36
SLIDE 36
  • Studydates:May– October2013
  • FourPVCTswithceramictilesplacedateachsite
  • AllTsplacedatsametidalelevation
  • Tilescollectedbiweekly
  • Allsettledoysterscountedinlab
  • New/cleantilesreturnedtothefield

OysterSettlement METHODS

slide-37
SLIDE 37

OysterSettlement– RESULTS

ErrorBars=±1SE

slide-38
SLIDE 38

OysterSettlement– RESULTS

ErrorBars=±1SE

slide-39
SLIDE 39

OysterSettlement– RESULTS

slide-40
SLIDE 40

OysterSettlement– RESULTS

slide-41
SLIDE 41

OysterSettlement– RESULTS

slide-42
SLIDE 42

OysterSettlement– RESULTS

slide-43
SLIDE 43

OysterSettlementinNewportBay

ErrorBars=±1SE

slide-44
SLIDE 44

OysterSettlementinNewportBay

ErrorBars=±1SE

slide-45
SLIDE 45
  • Studydates:May– October2013
  • TwoPVCTswithceramictilesplacedateachsite
  • Tilescollectedmonthly
  • Tenoysterspertilemarkedmeasuredforgrowth
  • Growthtilesthenreturnedtofield.

OysterGrowth METHODS

slide-46
SLIDE 46

OysterGrowth– RESULTS

ErrorBars=±1SE

slide-47
SLIDE 47

OysterGrowth– RESULTS

slide-48
SLIDE 48

OysterGrowth– RESULTS

slide-49
SLIDE 49

OysterGrowth– RESULTS

slide-50
SLIDE 50

OysterSettlementandGrowth– PreliminaryConclusions

  • None of the six sites appear settlement limited.
  • Post-settlement processes are important.
  • Based on 2013 data, all six sites could be viable

restoration sites.

slide-51
SLIDE 51

OysterDistributionStudies METHODS

  • Quantitative: Density and habitat % cover at six

study sites

– Laid out 50 m X 2 m transect at + 1.0 MLLW – Randomly placed 30 quadrats for point-contact and density counts of native and non-native oysters

slide-52
SLIDE 52

OysterDistributionStudies RESULTS

10 20 30 40 50 60 70 80 90 100 Chula Vista DStreet Grand Caribe JStreet Pond11 N Pond11 S Signature Park

%HardSubstrata

  • At+1.0MLLW,verydifferentamountsofhardsubstrataavailable
  • %Hardsubstratevariedwidelyacrosssitesatthetidalheightsurveyed
slide-53
SLIDE 53

OysterDistributionStudies RESULTS

ErrorBars=±1SE

  • At+1.0ft.MLLW,morenativesthannonnatives
  • Bothspeciesofoysterswerepresentatallsites
  • Habitatdifferences– ChulaVistawascobble,D streetwasmud,etc.
  • Somesamplingbiasesandanerror

50 100 150 200 250 300 ChulaVista DStreet Marsh Grand CaribeIsle JStreet Marina Pond11 North Pond11 South Signature Park Oysters/m2 O.lurida C.gigas

slide-54
SLIDE 54

R² = 0.9044 R² = 0.0468

  • 50

50 100 150 200 250

20 40 60 80 100

Oysters/m2

% Hard Substrata

  • O. lurida
  • C. gigas

OysterDistributionStudies RESULTS

slide-55
SLIDE 55

OysterDistributionStudies– Newport Bay(20102012)

ErrorBars=±1SE

10 20 30 40 50 60 70 80 90 15th Street Coney Island Hwy 1 Rocky Point

Oysters/m2

  • O. lurida
  • C. gigas
  • NativeoysterdensityinSanDiegoBayiscomparableto

NewportBay,nonnativesaremoreabundantinSanDiegoBay thaninNewportBay

slide-56
SLIDE 56

OysterDistributionStudies– LidoIsland, NewportBay(2011)

ErrorBars=±1SE

slide-57
SLIDE 57
  • Bothnativeandnonnativeoystersare

presentatnearlyalllocationssurveyed throughoutthebay

  • Densitiesofnativeoystersarecomparableto

NewportBay,nonnativesaremoreabundant inSanDiegoBaythaninNewportBay

  • Nativeoysterdensityiscorrelatedwith%hard

substrata,nonnativeoysterdensityisnot

OysterDistributionStudies– PreliminaryConclusions

slide-58
SLIDE 58

ProjectObjectives

1. EvaluateexistingandhistoricaldistributionofoystersintheBay. 2. Determinesuitablelocationsforoysterbedrestoration,using existingandnewdata. 3. IdentifyappropriateenergyenvironmentsandsitesintheBaythat couldmostbenefit(intermsoferosioncontrolandecological function)fromoysterbedcreation. 4. Useapilotscaleapproachtoestablishdemonstrationoysterbeds. 5. Determinetheextenttowhichoysterreefsenhancehabitatfor invertebrates,fish,andbirds,relativetoareaslackingstructureand relativetoprerestorationconditions. 6. Evaluatethepotentialforoysterbedstoreducewaterflow velocities,attenuatewaves,reduceerosion,andpromotesediment capture.

slide-59
SLIDE 59

PhysicalStudies QUESTION

  • Where are wave energies highest and lowest in the

Bay?

slide-60
SLIDE 60

PhysicalStudies– WINDWAVES

  • Complete preliminary modeling of wave energies

using existing data

– The Hasselmann Method from the Shore Protection Manual calculates shallow water wave power from water depth, wind speed, and fetch length

  • The water depth was calculated as the difference between MHHW

and the bathymetry (as a simplifying assumption)

  • Fetch length was calculated as the distance to a point above

MHHW

  • Wind speed was from CIMIS station #184

– Instantaneous wave power was calculated at each point in a grid for each wind speed and each direction – The wave power was weighted by the % occurrence of each wind speed and direction

slide-61
SLIDE 61

Physical Studies RESULTS

  • High wave

power along the southeastern shore

  • Low wave power

in the north and along the west shore

slide-62
SLIDE 62

TACMeetingActions

  • Determinepotentialoysterbedrestorationsites
  • Identifystudiestofillgapsatpotentialrestoration

sites.

NextSteps

  • Identifyfinalsite(s)
  • Developconceptualdesign
  • Developstudyplan
  • Fundandimplementsecondphase
slide-63
SLIDE 63

CriteriaforPotentialRestorationSites

  • TIERI:Criteriaforallpossiblerestorationsites:

– Bathymetry – Physiologicalparameters– salinity,turbidity,DO,temperature, waterquality,nutrients,sedimenttype – Hydrologicregime(Energyenvironment,inundation/tidal elevation)

  • TIERII:Criteriaforallsitesthatwouldhelpuslearn

somethingabouteffectsofoysterbedrestorationon waveenergy:

– Notarmored – Erosivesites – Highwaveenergy – Offshoreofmarshesthatwewanttoprotect

  • TIERIII:Criteriaforsitesthatarefeasible:

– Propertyownership – Access

slide-64
SLIDE 64

Potential Restoration Sites

slide-65
SLIDE 65

DataGaps

  • PhysicalEnvironmentDataNeeds

– WaveEnergyandShorelineErosion – Sedimentation – SedimentTypeatRestorationSite(s) – WaterQuality

  • BiologicalDataNeeds

– Settlementandgrowthforotherspecies – Bettergrowthdatafornativeoysters – Causesofobservedoysterspecieszonation

slide-66
SLIDE 66

Physical Studies WIND

  • Wind data from

CIMIS station #184 had the longest data set closest to the bay

slide-67
SLIDE 67

Physical Studies WIND

  • Wind data from

CIMIS station #184, located at Balboa Park, was used to generate a %

  • ccurrence table
slide-68
SLIDE 68

Physical Studies– WATER DEPTH

  • Water depths

were calculated at each point using the Merkel bathymetry

slide-69
SLIDE 69

Physical Studies– WINDFETCH

  • Fetch length was

calculated from each point to the nearest point above MHHW in each direction

  • Wave height,

period, and power was calculated for each direction and a range of wind speeds

slide-70
SLIDE 70

Physical Studies– WAVE POWER

  • Wave power for

each direction and wind speed is weighted by %

  • ccurrence and

summed to give a total average annual wave power index

slide-71
SLIDE 71

FieldStudies

  • GISdatacollection(bathymetry,tides,shoreline
  • wnership,etc.)
  • Weatherstationandwavegauges
  • Waterquality(temperature,salinity,turbidity,

etc.)

  • Modeling
slide-72
SLIDE 72

PhysicalStudies– DATACOLLECTION PLAN

Goal:

  • Confirm Bay wind

and waves

  • Establish erosion

thresholds Plan:

  • Wind gage
  • Directional wave

gage (ADCP)

  • Shoreline wave

gages (pressure sensors)

– Two eroding sites – Two stable sites

slide-73
SLIDE 73
slide-74
SLIDE 74

PhysicalData SEDIMENT

  • Sampling

locations for Merkel 2000 study

slide-75
SLIDE 75

PhysicalStudies– SedimentGrainSize

  • Grain Size Analysis (Merkel 2000)
slide-76
SLIDE 76

PhysicalStudies– SedimentDeposition

  • Sediment Deposition (Merkel 2000)

(Eelgrass present initially) (Eelgrass not present initially)

slide-77
SLIDE 77

PhysicalStudies– SedimentDeposition

  • Sediment Deposition (Merkel 2000)
slide-78
SLIDE 78

PhysicalStudies Salinity

  • Salinity (Merkel 2000)

(Eelgrass present initially) (Eelgrass not present initially)

slide-79
SLIDE 79

PhysicalStudies DATA

  • Salinity (Tierra Data 2012)
slide-80
SLIDE 80

PhysicalStudies DATA

  • Salinity (Tierra Data 2012)
slide-81
SLIDE 81

PercentRecovery

slide-82
SLIDE 82

Merkel & Associates, Inc.

5434 Ruffin Road, San Diego, CA 92123 Tel: 858/560-5465  Fax: 858/560-7779 e-mail: associates@merkelinc.com Environmental Shoreline Erosion Protection Demonstration Project Contract 55724 Quarterly Progress Report No. 12

Quarter ending August 31, 2012

DESCRIPTION OF WORK COMPLETED

 Final edits to Year 1 monitoring report

CUMULATIVE DOLLAR COSTS INCURRED

$106,964.49 (before 25% matching funds deduction. $80,223.36 of project budget)

ANTICIPATED WORK FOR NEXT QUARTER

 No additional work will occur until after the end of the tern breeding season (September 15).

PERCENTAGE OF WORK COMPLETE

41%

EXPECTED COMPLETION DATE FOR REMAINING WORK

All work, including Project Final Report, will be completed on or before August 31, 2014

PROBLEM AREAS/ISSUES THAT MAY AFFECT PROJECT COST AND/OR SCHEDULE

No issues thus far. Keith W. Merkel Principal Consultant

slide-83
SLIDE 83

Merkel & Associates, Inc.

5434 Ruffin Road, San Diego, CA 92123 Tel: 858/560-5465  Fax: 858/560-7779 e-mail: associates@merkelinc.com Environmental Shoreline Erosion Protection Demonstration Project Contract 55724 Quarterly Progress Report No. 13

Quarter ending November 30, 2012

DESCRIPTION OF WORK COMPLETED

 No work conducted during this quarter

CUMULATIVE DOLLAR COSTS INCURRED

$106,964.48 (before 25% matching funds deduction. $80,223.36 of project budget)

ANTICIPATED WORK FOR NEXT QUARTER PERCENTAGE OF WORK COMPLETE

41%

EXPECTED COMPLETION DATE FOR REMAINING WORK

All work, including Project Final Report, will be completed on or before August 31, 2014

PROBLEM AREAS/ISSUES THAT MAY AFFECT PROJECT COST AND/OR SCHEDULE

No issues thus far. Keith W. Merkel Principal Consultant

slide-84
SLIDE 84

Merkel & Associates, Inc.

5434 Ruffin Road, San Diego, CA 92123 Tel: 858/560-5465  Fax: 858/560-7779 e-mail: associates@merkelinc.com Environmental Shoreline Erosion Protection Demonstration Project Contract 55724 Quarterly Progress Report No. 14

Quarter ending February 28, 2013

DESCRIPTION OF WORK COMPLETED

 Preparation for March monitoring work

CUMULATIVE DOLLAR COSTS INCURRED

$107,071.49 (before 25% matching funds deduction. $80,303.61 of project budget)

ANTICIPATED WORK FOR NEXT QUARTER

 Monitoring/assessment of treatments and plantings.

PERCENTAGE OF WORK COMPLETE

41%

EXPECTED COMPLETION DATE FOR REMAINING WORK

All work, including Project Final Report, will be completed on or before August 31, 2014

PROBLEM AREAS/ISSUES THAT MAY AFFECT PROJECT COST AND/OR SCHEDULE

No issues thus far. Keith W. Merkel Principal Consultant

slide-85
SLIDE 85

Merkel & Associates, Inc.

5434 Ruffin Road, San Diego, CA 92123 Tel: 858/560-5465  Fax: 858/560-7779 e-mail: associates@merkelinc.com Environmental Shoreline Erosion Protection Demonstration Project Contract 55724 Quarterly Progress Report No. 15

Quarter ending May 31, 2012

DESCRIPTION OF WORK COMPLETED

 Monitoring/assessment of treatments and plantings

CUMULATIVE DOLLAR COSTS INCURRED

$112,172.24 (before 25% matching funds deduction. $84,129.18 of project budget)

ANTICIPATED WORK FOR NEXT QUARTER

 Preparation of Year 2 monitoring report

PERCENTAGE OF WORK COMPLETE

44%

EXPECTED COMPLETION DATE FOR REMAINING WORK

All work, including Project Final Report, will be completed on or before August 31, 2014

PROBLEM AREAS/ISSUES THAT MAY AFFECT PROJECT COST AND/OR SCHEDULE

No issues thus far. Keith W. Merkel Principal Consultant

slide-86
SLIDE 86

Merkel & Associates, Inc.

5434 Ruffin Road, San Diego, CA 92123 Tel: 858/560-5465  Fax: 858/560-7779 e-mail: associates@merkelinc.com Environmental Shoreline Erosion Protection Demonstration Project Contract 55724 Quarterly Progress Report No. 16

Quarter ending August 31, 2013

DESCRIPTION OF WORK COMPLETED

 Preparation of Year 2 monitoring report  Scope of contract changed to focus on living shoreline oyster reef  Contract end date extended to August 31, 2015  Oyster settlement, growth, and distribution sites implemented at six sites in South San Diego Bay  Collection and analysis of historic oyster data for San Diego Bay

CUMULATIVE DOLLAR COSTS INCURRED

$142,320.65 (before 25% matching funds deduction. $106,740.49 of project budget)

ANTICIPATED WORK FOR NEXT QUARTER

 Address any comments to Year 2 monitoring report  Analyze field data collected in oyster settlement, growth, and distribution studies  Prepare 2-D model to predict wave energies in San Diego Bay

PERCENTAGE OF WORK COMPLETE

55%

EXPECTED COMPLETION DATE FOR REMAINING WORK

All work, including Project Final Report, will be completed on or before August 31, 2015

PROBLEM AREAS/ISSUES THAT MAY AFFECT PROJECT COST AND/OR SCHEDULE

No issues thus far. Keith W. Merkel Principal Consultant

slide-87
SLIDE 87

Merkel & Associates, Inc.

5434 Ruffin Road, San Diego, CA 92123 Tel: 858/560-5465  Fax: 858/560-7779 e-mail: associates@merkelinc.com Environmental Shoreline Erosion Protection Demonstration Project Contract 55724 Quarterly Progress Report No. 17

Quarter ending November 30, 2013

DESCRIPTION OF WORK COMPLETED

 Analyzed field data collected in oyster settlement, growth, and distribution studies  Prepared 2-D model to predict wave energies in San Diego Bay

CUMULATIVE DOLLAR COSTS INCURRED

$133,280.73 of project budget

ANTICIPATED WORK FOR NEXT QUARTER

 Prepare for and conduct first Technical Advisory Committee (TAC) meeting. Data presented to include preliminary results from oyster settlement, growth, and distribution studies, as well as 2-D wave energy model and presentation of historic oyster distribution data  Select potential oyster reef restoration sites  Deploy wave gauges at potential restoration sites

PERCENTAGE OF WORK COMPLETE

69%

EXPECTED COMPLETION DATE FOR REMAINING WORK

All work, including Project Final Report, will be completed on or before August 31, 2015

PROBLEM AREAS/ISSUES THAT MAY AFFECT PROJECT COST AND/OR SCHEDULE

No issues thus far. Keith W. Merkel Principal Consultant