
SLIDE 1
1
Sampling and Probability
Learning Objectives
- Understand probability sampling
- Compute and interpret unconditional and
conditional probabilities
- Evaluate and interpret independence of events
2
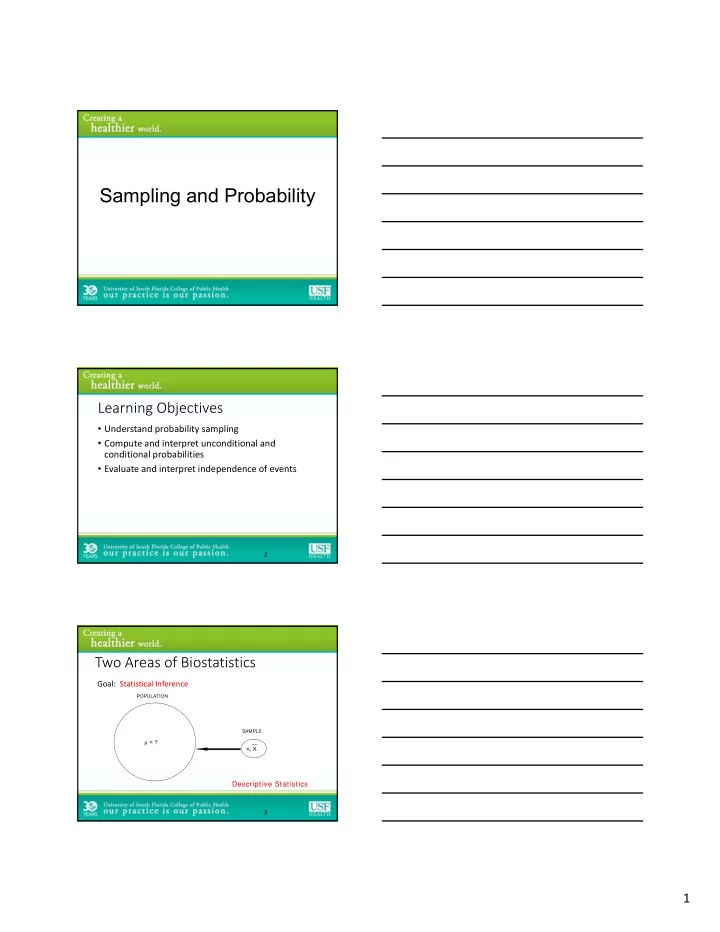
Two Areas of Biostatistics
Goal: Statistical Inference
POPULATION SAMPLE
µ = ? n, X
Descriptive Statistics
3