
SLIDE 1
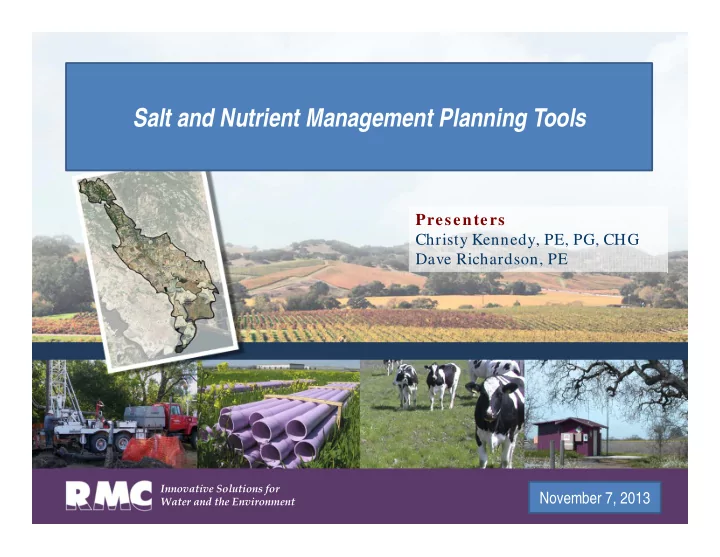
Implementing Salt and Nutrient Management Plan for the Sonoma Valley County Sanitation District
Innovative Solutions for Water and the Environment
July 28, 2011
Salt and Nutrient Management Planning Tools for the Sonoma Valley - - PowerPoint PPT Presentation
Implementing Salt and Nutrient Management Plan Salt and Nutrient Management Planning Tools for the Sonoma Valley County Sanitation District Presenters Christy Kennedy, PE, PG, CHG Dave Richardson, PE Innovative Solutions for July 28, 2011
Innovative Solutions for Water and the Environment
July 28, 2011
Implementation Measures Implementation Measures Integration into Bay Area IRWMP Integration into Bay Area IRWMP Anti-degradation Analysis Anti-degradation Analysis Potential Source Identification Potential Source Identification Land Use Verification Land Use Verification Draft GW Monitoring Plan Draft GW Monitoring Plan RW & Stormwater Goals & Objectives RW & Stormwater Goals & Objectives Assimilative Capacity, Fate & Transport Assimilative Capacity, Fate & Transport Salt & Nutrient Plan Compilation Salt & Nutrient Plan Compilation Final Plan & BAIRWMP Document
Work shop 1 Work shop 2 Work shop 3 Work shop 4 Work shop 6 Work shop 5
Workshop 5 with Bay Area Coordinating committee
Loading Results Loading Results
ET Precipitation and Applied Water Demand Runoff Water Demand Recharge/ Storage
Salt Load Nutrient Load
List of Landuse
Agriculture
Commercial/Industrial
Loading Landuse
(Salts)
(Nutrients)
(Nutrients)
(Nutrients) Landuse Factors
Land Use Irrigation Requirements Fertilizer/ Amendment Requirements
Nutrient Module Salt Module
Source Water Quality Septic System Data Other Load Data Soil Textures
Septic Loads Land Use Loads Other Loads (Infrastructure, etc)
Vines Ranchettes Other CAFOs Urban Residential