
SLIDE 1
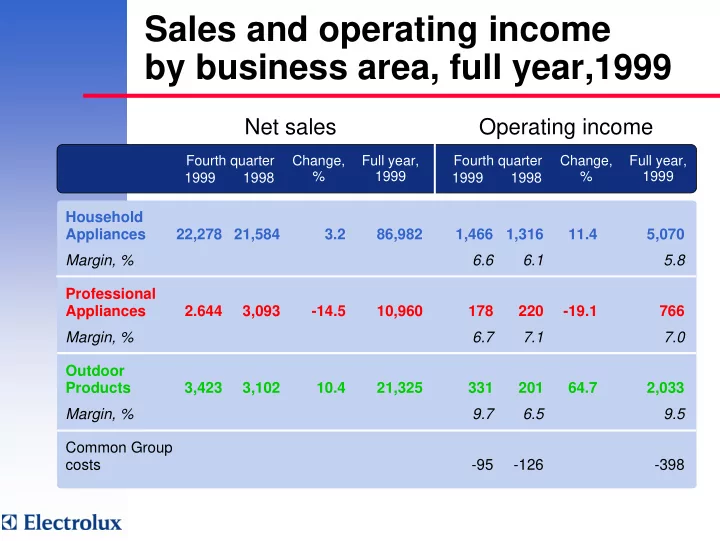
Sales and operating income by business area, full year,1999
Fourth quarter Change, % Full year, 1999 1999 1998
Household Appliances 22,278 21,584 3.2 86,982 1,466 1,316 11.4 5,070 Margin, % 6.6 6.1 5.8 Professional Appliances 2.644 3,093
- 14.5
10,960 178 220
- 19.1
766 Margin, % 6.7 7.1 7.0 Outdoor Products 3,423 3,102 10.4 21,325 331 201 64.7 2,033 Margin, % 9.7 6.5 9.5 Common Group costs
- 95
- 126
- 398
Fourth quarter Change, % Full year, 1999 1999 1998