SLIDE 1 Printed on 1/30/2013 at 10:50 AM Last revised on 5/25/2012
Contribution-Based Benefit Cap (CBBC) Calculator - Example 1
Members can use this calculator to gain familiarity with the effect of CBBC under different pay scenarios. For simplicity, this calculator assumes that you: Salary history (up to 20 years) can be found online under your OPERS account and also on page 5 of your
- Will retire from the Traditional Plan.
annual statement. Personalized benefit estimates that reflect any adopted anti-spiking provision will be
- Have only been employed by State/Local
government (non law enforcement).
- Do not have any service purchase or
Step 1 – Enter your transition group. Use the first calculator in the Special Coverage section of our web site. restored service credit. Step 2 – Enter the year you joined OPERS.
- Begin OPERS-covered employment on
Step 3 – Enter the year you will terminate your employment. January 1 and terminate on December 31. Step 4 – Enter your age at retirement, rounded to the nearest whole number.
- Have earned full-time service credit in all
Step 5 – Enter your annual salary for each year of employment. These can be close estimates or left blank. 12 months of the years worked. Transition group: Group A Year joined OPERS: 1989 Termination year: 2018 Retirement date: 1/1/2019 Retirement age: 60
← Rounded to the nearest whole number
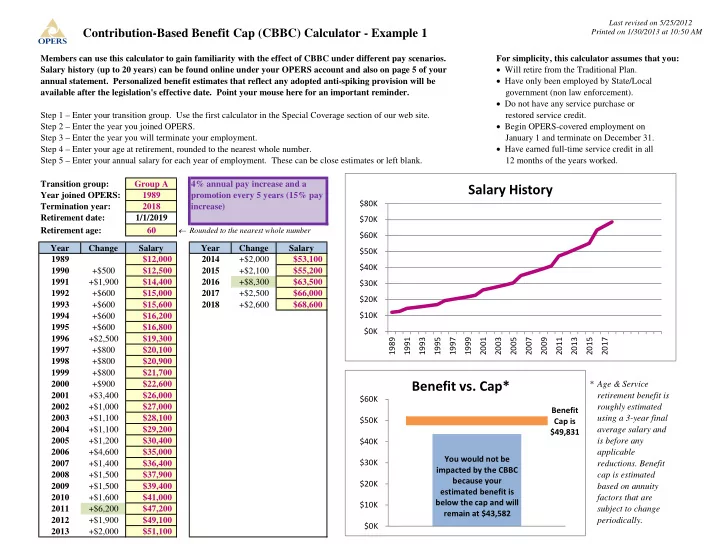
Year Change Salary Year Change Salary 1989 $12,000 2014 +$2,000 $53,100 1990 +$500 $12,500 2015 +$2,100 $55,200 1991 +$1,900 $14,400 2016 +$8,300 $63,500 1992 +$600 $15,000 2017 +$2,500 $66,000 1993 +$600 $15,600 2018 +$2,600 $68,600 1994 +$600 $16,200 1995 +$600 $16,800 1996 +$2,500 $19,300 1997 +$800 $20,100 1998 +$800 $20,900 1999 +$800 $21,700 2000 +$900 $22,600 * Age & Service 2001 +$3,400 $26,000 retirement benefit is 2002 +$1,000 $27,000 roughly estimated 2003 +$1,100 $28,100 using a 3-year final 2004 +$1,100 $29,200 average salary and 2005 +$1,200 $30,400 is before any 2006 +$4,600 $35,000 applicable 2007 +$1,400 $36,400
2008 +$1,500 $37,900 cap is estimated 2009 +$1,500 $39,400 based on annuity 2010 +$1,600 $41,000 factors that are 2011 +$6,200 $47,200 subject to change 2012 +$1,900 $49,100 periodically. 2013 +$2,000 $51,100 4% annual pay increase and a promotion every 5 years (15% pay increase) available after the legislation's effective date. Point your mouse here for an important reminder. $0K $10K $20K $30K $40K $50K $60K $70K $80K 1989 1991 1993 1995 1997 1999 2001 2003 2005 2007 2009 2011 2013 2015 2017
Salary History
Benefit Cap is $49,831 $0K $10K $20K $30K $40K $50K $60K
Benefit vs. Cap*
You would not be impacted by the CBBC because your estimated benefit is below the cap and will remain at $43,582
SLIDE 2 Printed on 1/30/2013 at 10:50 AM Last revised on 5/25/2012
Contribution-Based Benefit Cap (CBBC) Calculator - Example 2
Members can use this calculator to gain familiarity with the effect of CBBC under different pay scenarios. For simplicity, this calculator assumes that you: Salary history (up to 20 years) can be found online under your OPERS account and also on page 5 of your
- Will retire from the Traditional Plan.
annual statement. Personalized benefit estimates that reflect any adopted anti-spiking provision will be
- Have only been employed by State/Local
government (non law enforcement).
- Do not have any service purchase or
Step 1 – Enter your transition group. Use the first calculator in the Special Coverage section of our web site. restored service credit. Step 2 – Enter the year you joined OPERS.
- Begin OPERS-covered employment on
Step 3 – Enter the year you will terminate your employment. January 1 and terminate on December 31. Step 4 – Enter your age at retirement, rounded to the nearest whole number.
- Have earned full-time service credit in all
Step 5 – Enter your annual salary for each year of employment. These can be close estimates or left blank. 12 months of the years worked. Transition group: Group A Year joined OPERS: 1989 Termination year: 2018 Retirement date: 1/1/2019 Retirement age: 60
← Rounded to the nearest whole number
Year Change Salary Year Change Salary 1989 $12,000 2014 +$102,200 $153,300 1990 +$500 $12,500 2015 +$6,100 $159,400 1991 +$1,900 $14,400 2016 +$6,400 $165,800 1992 +$600 $15,000 2017 +$6,600 $172,400 1993 +$600 $15,600 2018 +$6,900 $179,300 1994 +$600 $16,200 1995 +$600 $16,800 1996 +$2,500 $19,300 1997 +$800 $20,100 1998 +$800 $20,900 1999 +$800 $21,700 2000 +$900 $22,600 * Age & Service 2001 +$3,400 $26,000 retirement benefit is 2002 +$1,000 $27,000 roughly estimated 2003 +$1,100 $28,100 using a 3-year final 2004 +$1,100 $29,200 average salary and 2005 +$1,200 $30,400 is before any 2006 +$4,600 $35,000 applicable 2007 +$1,400 $36,400
2008 +$1,500 $37,900 cap is estimated 2009 +$1,500 $39,400 based on annuity 2010 +$1,600 $41,000 factors that are 2011 +$6,200 $47,200 subject to change 2012 +$1,900 $49,100 periodically. 2013 +$2,000 $51,100 available after the legislation's effective date. Point your mouse here for an important reminder. Same as example 1, except for a 300% pay increase 5 years before retirement. $0K $20K $40K $60K $80K $100K $120K $140K $160K $180K $200K 1989 1991 1993 1995 1997 1999 2001 2003 2005 2007 2009 2011 2013 2015 2017
Salary History
Benefit Cap is $74,175 $0K $10K $20K $30K $40K $50K $60K $70K $80K
Benefit vs. Cap*
You would be impacted by the CBBC because of your salary history and the estimated benefit of $113,850 will be capped at $74,175
SLIDE 3 Printed on 1/30/2013 at 10:50 AM Last revised on 5/25/2012
Contribution-Based Benefit Cap (CBBC) Calculator - Example 3
Members can use this calculator to gain familiarity with the effect of CBBC under different pay scenarios. For simplicity, this calculator assumes that you: Salary history (up to 20 years) can be found online under your OPERS account and also on page 5 of your
- Will retire from the Traditional Plan.
annual statement. Personalized benefit estimates that reflect any adopted anti-spiking provision will be
- Have only been employed by State/Local
government (non law enforcement).
- Do not have any service purchase or
Step 1 – Enter your transition group. Use the first calculator in the Special Coverage section of our web site. restored service credit. Step 2 – Enter the year you joined OPERS.
- Begin OPERS-covered employment on
Step 3 – Enter the year you will terminate your employment. January 1 and terminate on December 31. Step 4 – Enter your age at retirement, rounded to the nearest whole number.
- Have earned full-time service credit in all
Step 5 – Enter your annual salary for each year of employment. These can be close estimates or left blank. 12 months of the years worked. Transition group: Group A Year joined OPERS: 1989 Termination year: 2018 Retirement date: 1/1/2019 Retirement age: 60
← Rounded to the nearest whole number
Year Change Salary Year Change Salary 1989 $12,000 2014 +$1,000 $26,300 1990 +$500 $12,500 2015 +$1,100 $27,400 1991 +$500 $13,000 2016 +$1,100 $28,500 1992 +$500 $13,500 2017 +$1,100 $29,600 1993 +$500 $14,000 2018 +$1,200 $30,800 1994 +$600 $14,600 1995 +$600 $15,200 1996 +$600 $15,800 1997 +$600 $16,400 1998 +$700 $17,100 1999 +$700 $17,800 2000 +$700 $18,500 * Age & Service 2001 +$37,000 $55,500 retirement benefit is 2002 +$2,200 $57,700 roughly estimated 2003 +$2,300 $60,000 using a 3-year final 2004 +$2,400 $62,400 average salary and 2005 +$2,500 $64,900 is before any 2006
$19,200 applicable 2007 +$800 $20,000
2008 +$800 $20,800 cap is estimated 2009 +$800 $21,600 based on annuity 2010 +$900 $22,500 factors that are 2011 +$900 $23,400 subject to change 2012 +$900 $24,300 periodically. 2013 +$1,000 $25,300 available after the legislation's effective date. Point your mouse here for an important reminder. Mid career spiking $0K $10K $20K $30K $40K $50K $60K $70K 1989 1991 1993 1995 1997 1999 2001 2003 2005 2007 2009 2011 2013 2015 2017
Salary History
Benefit Cap is $40,202 $0K $5K $10K $15K $20K $25K $30K $35K $40K $45K
Benefit vs. Cap*
You would be impacted by the CBBC because of your salary history and the estimated benefit of $41,206 will be capped at $40,202
SLIDE 4 Printed on 1/30/2013 at 10:50 AM Last revised on 5/25/2012
Contribution-Based Benefit Cap (CBBC) Calculator - Example 4
Members can use this calculator to gain familiarity with the effect of CBBC under different pay scenarios. For simplicity, this calculator assumes that you: Salary history (up to 20 years) can be found online under your OPERS account and also on page 5 of your
- Will retire from the Traditional Plan.
annual statement. Personalized benefit estimates that reflect any adopted anti-spiking provision will be
- Have only been employed by State/Local
government (non law enforcement).
- Do not have any service purchase or
Step 1 – Enter your transition group. Use the first calculator in the Special Coverage section of our web site. restored service credit. Step 2 – Enter the year you joined OPERS.
- Begin OPERS-covered employment on
Step 3 – Enter the year you will terminate your employment. January 1 and terminate on December 31. Step 4 – Enter your age at retirement, rounded to the nearest whole number.
- Have earned full-time service credit in all
Step 5 – Enter your annual salary for each year of employment. These can be close estimates or left blank. 12 months of the years worked. Transition group: Group A Year joined OPERS: 1989 Termination year: 2018 Retirement date: 1/1/2019 Retirement age: 60
← Rounded to the nearest whole number
Year Change Salary Year Change Salary 1989 $12,000 2014 +$40,800 $53,100 1990 +$500 $12,500 2015 +$2,100 $55,200 1991 +$1,900 $14,400 2016 +$8,300 $63,500 1992 +$600 $15,000 2017 +$2,500 $66,000 1993 +$600 $15,600 2018 +$2,600 $68,600 1994 +$600 $16,200 1995 +$600 $16,800 1996 +$2,500 $19,300 1997 +$800 $20,100 1998 +$800 $20,900 1999
$5,200 2000 +$200 $5,400 * Age & Service 2001 +$800 $6,200 retirement benefit is 2002 +$200 $6,400 roughly estimated 2003 +$300 $6,700 using a 3-year final 2004 +$300 $7,000 average salary and 2005 +$300 $7,300 is before any 2006 +$1,100 $8,400 applicable 2007 +$300 $8,700
2008 +$300 $9,000 cap is estimated 2009 +$400 $9,400 based on annuity 2010 +$400 $9,800 factors that are 2011 +$1,500 $11,300 subject to change 2012 +$500 $11,800 periodically. 2013 +$500 $12,300 available after the legislation's effective date. Point your mouse here for an important reminder. Full time, part time, and full time again $0K $10K $20K $30K $40K $50K $60K $70K $80K 1989 1991 1993 1995 1997 1999 2001 2003 2005 2007 2009 2011 2013 2015 2017
Salary History
Benefit Cap is $30,721 $0K $5K $10K $15K $20K $25K $30K $35K
Benefit vs. Cap*
You would be impacted by the CBBC because of your salary history and the estimated benefit of $43,582 will be capped at $30,721
SLIDE 5 Printed on 1/30/2013 at 10:50 AM Last revised on 5/25/2012
Contribution-Based Benefit Cap (CBBC) Calculator - Example 5
Members can use this calculator to gain familiarity with the effect of CBBC under different pay scenarios. For simplicity, this calculator assumes that you: Salary history (up to 20 years) can be found online under your OPERS account and also on page 5 of your
- Will retire from the Traditional Plan.
annual statement. Personalized benefit estimates that reflect any adopted anti-spiking provision will be
- Have only been employed by State/Local
government (non law enforcement).
- Do not have any service purchase or
Step 1 – Enter your transition group. Use the first calculator in the Special Coverage section of our web site. restored service credit. Step 2 – Enter the year you joined OPERS.
- Begin OPERS-covered employment on
Step 3 – Enter the year you will terminate your employment. January 1 and terminate on December 31. Step 4 – Enter your age at retirement, rounded to the nearest whole number.
- Have earned full-time service credit in all
Step 5 – Enter your annual salary for each year of employment. These can be close estimates or left blank. 12 months of the years worked. Transition group: Group A Year joined OPERS: 1989 Termination year: 2018 Retirement date: 1/1/2019 Retirement age: 60
← Rounded to the nearest whole number
Year Change Salary Year Change Salary 1989 $12,000 2014 +$22,800 $53,100 1990 +$500 $12,500 2015 +$2,100 $55,200 1991 +$1,900 $14,400 2016 +$8,300 $63,500 1992 +$600 $15,000 2017 +$2,500 $66,000 1993 +$600 $15,600 2018 +$2,600 $68,600 1994 +$600 $16,200 1995 +$600 $16,800 1996 +$2,500 $19,300 1997 +$800 $20,100 1998 +$800 $20,900 1999 +$800 $21,700 2000 +$900 $22,600 * Age & Service 2001 +$3,400 $26,000 retirement benefit is 2002 +$1,000 $27,000 roughly estimated 2003 +$1,100 $28,100 using a 3-year final 2004 +$1,100 $29,200 average salary and 2005 +$1,200 $30,400 is before any 2006 +$4,600 $35,000 applicable 2007 +$1,400 $36,400
2008 +$1,500 $37,900 cap is estimated 2009
$30,300 based on annuity 2010 +$0 $30,300 factors that are 2011 +$0 $30,300 subject to change 2012 +$0 $30,300 periodically. 2013 +$0 $30,300 available after the legislation's effective date. Point your mouse here for an important reminder. 20% pay reduction in 2009 and freezed for 4 additional years, then a large pay increase to catch up $0K $10K $20K $30K $40K $50K $60K $70K $80K 1989 1991 1993 1995 1997 1999 2001 2003 2005 2007 2009 2011 2013 2015 2017
Salary History
Benefit Cap is $46,118 $0K $10K $20K $30K $40K $50K
Benefit vs. Cap*
You would not be impacted by the CBBC because your estimated benefit is below the cap and will remain at $43,582
SLIDE 6 Example 1 Example 2 Example 3 Example 4 Exam Year Salary Change Salary Salary Change Salary Salary Change Salary Salary Change Salary Salary Change 1989 $12,000 $12,000 $12,000 $12,000 1990 4% $12,500 4% $12,500 4% $12,500 4% $12,500 4% 1991 15% $14,400 15% $14,400 15% $14,400 4% $13,000 15% 1992 4% $15,000 4% $15,000 4% $15,000 4% $13,500 4% 1993 4% $15,600 4% $15,600 4% $15,600 4% $14,000 4% 1994 4% $16,200 4% $16,200 4% $16,200 4% $14,600 4% 1995 4% $16,800 4% $16,800 4% $16,800 4% $15,200 4% 1996 15% $19,300 15% $19,300 15% $19,300 4% $15,800 15% 1997 4% $20,100 4% $20,100 4% $20,100 4% $16,400 4% 1998 4% $20,900 4% $20,900 4% $20,900 4% $17,100 4% 1999 4% $21,700 4% $21,700 4% $21,700 4% $17,800
2000 4% $22,600 4% $22,600 4% $22,600 4% $18,500 4% 2001 15% $26,000 15% $26,000 15% $26,000 200% $55,500 15% 2002 4% $27,000 4% $27,000 4% $27,000 4% $57,700 4% 2003 4% $28,100 4% $28,100 4% $28,100 4% $60,000 4% 2004 4% $29,200 4% $29,200 4% $29,200 4% $62,400 4% 2005 4% $30,400 4% $30,400 4% $30,400 4% $64,900 4% 2006 15% $35,000 15% $35,000 15% $35,000
$19,200 15% 2007 4% $36,400 4% $36,400 4% $36,400 4% $20,000 4% 2008 4% $37,900 4% $37,900 4% $37,900 4% $20,800 4% 2009 4% $39,400 4% $39,400
$30,300 4% $21,600 4% 2010 4% $41,000 4% $41,000 0% $30,300 4% $22,500 4% 2011 15% $47,200 15% $47,200 0% $30,300 4% $23,400 15% 2012 4% $49,100 4% $49,100 0% $30,300 4% $24,300 4% 2013 4% $51,100 4% $51,100 0% $30,300 4% $25,300 4% 2014 4% $53,100 200% $153,300 75% $53,100 4% $26,300 332% 2015 4% $55,200 4% $159,400 4% $55,200 4% $27,400 4% 2016 15% $63,500 4% $165,800 15% $63,500 4% $28,500 15% 2017 4% $66,000 4% $172,400 4% $66,000 4% $29,600 4% 2018 4% $68,600 4% $179,300 4% $68,600 4% $30,800 4%
SLIDE 7
Salary $12,000 $12,500 $14,400 $15,000 $15,600 $16,200 $16,800 $19,300 $20,100 $20,900 $5,200 $5,400 $6,200 $6,400 $6,700 $7,000 $7,300 $8,400 $8,700 $9,000 $9,400 $9,800 $11,300 $11,800 $12,300 $53,100 $55,200 $63,500 $66,000 $68,600