
SLIDE 1
www.portsmouth.gov.uk
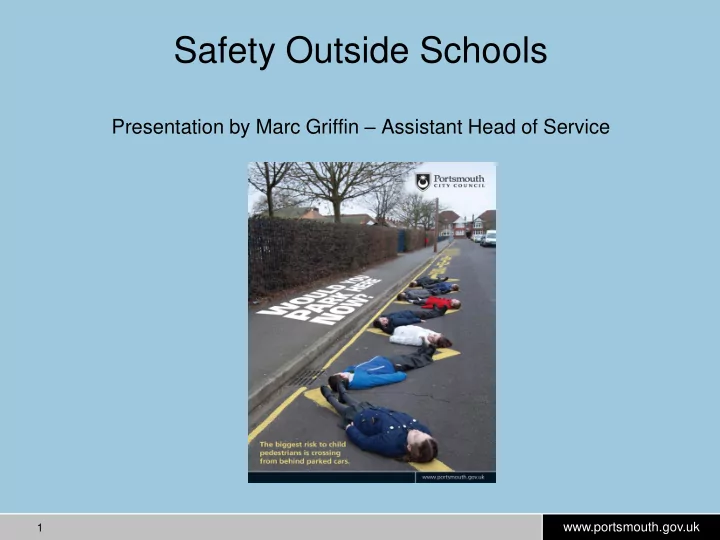
Safety Outside Schools
Presentation by Marc Griffin – Assistant Head of Service
1
Safety Outside Schools Presentation by Marc Griffin Assistant Head - - PowerPoint PPT Presentation
Safety Outside Schools Presentation by Marc Griffin Assistant Head of Service www.portsmouth.gov.uk 1 Average annual child pedestrian casualties per head of population Portsmouth has high child pedestrian casualties per size of
www.portsmouth.gov.uk
1
www.portsmouth.gov.uk
2
higher than national average
school every day which will result in higher casualties.
average of 56 per year down to an average of 39 per year with no fatalities during that period.
www.portsmouth.gov.uk
3
double the national average, however cycling levels in the City are also double the national average.
with an average of 26 per year throughout.
www.portsmouth.gov.uk
4
www.portsmouth.gov.uk
5
www.portsmouth.gov.uk
6
www.portsmouth.gov.uk
7
www.portsmouth.gov.uk
8
www.portsmouth.gov.uk
9
www.portsmouth.gov.uk
10
www.portsmouth.gov.uk
Key Stage 1&2 Contributory Factors:
30mph roads as the 20mph roads would normally have a lower share of casualties. Key road safety needs
properly.
children avoid children crossing from behind parked cars.
11
www.portsmouth.gov.uk
drivers have more responsibility with 15 cases of them failing to look properly.
roads where crossing infrastructure is wide spread.
light controlled crossings but the ped didn’t wait for the signal so effectively only 13 were at crossing points on roads where they are widely available.
Road Safety needs
12
www.portsmouth.gov.uk
13
economic down turn with more journeys being taken by bike or walking.
www.portsmouth.gov.uk
14
www.portsmouth.gov.uk
15
www.portsmouth.gov.uk
16
www.portsmouth.gov.uk
17
www.portsmouth.gov.uk
(blame is very difficult to attribute). Road Speed
the pavement and keeping to 20mph roads. Helmet Use
helmet Road Safety Needs Education – cycle training Engineering – improving infrastructure for all cyclists at high casualty sites
18
www.portsmouth.gov.uk
Out of 129 accidents two contributory factors stand out for cyclists :
drivers failing to see the cyclist and this is in line with all cycle collisions.
roads.
wearing a helmet. Road Safety Needs Education – cycle training- uptake is currently low at secondary
Engineering – improving infrastructure for all cyclists at high casualty sites
19