
SLIDE 1
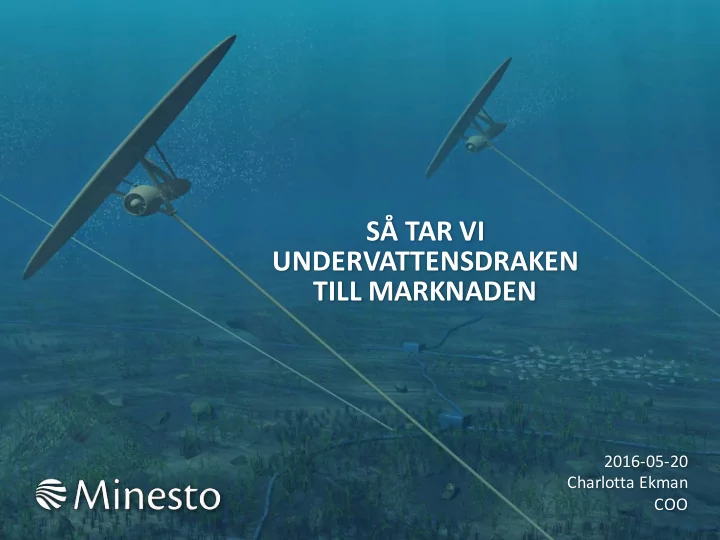
SÅ TAR VI UNDERVATTENSDRAKEN TILL MARKNADEN
2016-05-20 Charlotta Ekman COO
S TAR VI UNDERVATTENSDRAKEN TILL MARKNADEN 2016-05-20 Charlotta - - PowerPoint PPT Presentation
S TAR VI UNDERVATTENSDRAKEN TILL MARKNADEN 2016-05-20 Charlotta Ekman COO The Deep Green Tidal Power Plant 2 Deep Green How it works 75% of tidal current Specifications energy is in the upper 50% of the water column Wing Span 12
2016-05-20 Charlotta Ekman COO
2
3 Illustration of Deep Green in action 75% of tidal current energy is in the upper 50%
A tether attaches the turbine to the seabed and delivers electricity to the grid The figure-of-8 flight path is controlled by a rudder attached to the plant
Wing Span 12 Meters Rotor Diameter 1m Tether Length 65m or more Rated Power 500kw @ 1.6m/s Desired Velocity 1,4 m/s or more Installation Depth 50 m or more Devices/km2 18-26 Weight 7 tons
Specifications
4
Only known technology that operates cost-efficiently using low velocity tidal streams (1.2-2.4 m/s)
Kite motion accelerates water flow through the turbine, significantly increasing energy production
Each unit weighs 7 tonnes, 10-25 times less per MW than competing technologies
Able to use smaller and cheaper vessels for O&M and installation than competing technologies
Minesto Competition
Co Cost of Energy
Minesto Competition
Ca Capital Co Cost
Minesto Competition
We Weight
5
Who we work with
QuappenKite2006
SeaKiteI 2009
Marine, Netherlands
SeaKiteII 2011
Deep Green Ocean 2013-2019
Survivability analysis
Deep Green 500 2017
Deep Green Array 2018-2019
7
2 June 2016
€5m €13m €15.5m €5m
2 June 2016
€5m €13m €15.5m €5m
10MW Deep Green array
Offshore
Subsea cables On-shore service and maintenance Grid connection
Minesto’s products have a global market potential to generate electricity for £135 billion-pa in annual yield.
Ti Tidal Current Market Oc Ocean Current Market
“The Deep Green technology is able to
at sites where no other renowned technology has been identified”
Minesto’s ability to produce cost-efficient electricity at low velocity sites significantly expands the market potential, the market is valued to €250 250 bi billion n in annual electricity sales
El Electricity production Rated power: 0.5MW Power performance: 1,69 GWh/yr Capacity factor: 38,5% Cable efficiency: 94% Availability: 98%* Pr Project ct speci cifica cation Rated power: 30MW No of power plants: 60 No of spare units: 3 Location: UK Project life: 20 yrs Construction time: 2 yrs Fi Financial Electricity support: €180/ MWh for 15 yrs (CfD) Post support electricity payment: €90/MWh Discount rate: 8%/12%/15% Inflation: 2%
In Input data CA CAPEX Ca CapEx Co Cost of Energy & & In Invest stment Gr Graph for Fu Future Pr Projects
Quotes & Industry Experience Quotes & Industry Experience
*Post certification
5% 15% 9% 5% 9% 16% 9% 1% 31% 0% Pre project development Wing and nacelle structure Tether Anchoring point Foundation, Power transmission device Power transmission to shore Control system Deployment Decomissioning
OP OPEX
Op OpEx
59% 17% 15% 2% 7% Project Costs Kite: Routine O&M Kite: Non-Routine O&M Cable: Routine O&M Cable: Non-Routine O&M
Quotes & Industry Experience
the mobilization and service speed
land
Material needed to produce 500Kw @1.5m/s
Minesto Other
14 tonnes/MW vs vs 300 300 tonnes/MW
Accelerated learning curves
Simple, low cost transportation
€5.000/day €150.000/day
Accessible
Si Site Accessibility, year around Co Cost efficient O&M
50 100 150 200 250 300 350 400 450 1 10 100 1000 10000 COE €/MWh Cumulative Installed Capacity (MW) Deep Green COE Low/Med/High DR Offshore Wind UK Price 2014 UK Tidal 2035 Open Cycle Gas Turbine Price 2030 Onshore Wind Price 2014 Combined Cycle Gas Turbine Price 2030
Ge Generation (cum. power pl plant nts) 1 1 (4) 4) 7 7 (250) 250) 10 10 (2000) 2000) Project size 20MW 30MW 128MW COE NA €96-128/MWh €56-77/MWh IRR NA 26% 55% NPV NA € 66 252 173 € 223 430 280 Payback time NA 6 years 5 years Product cost € 1 549 297 € 497 095 € 280 137
CONFIDENTIAL 2 June 2016
”Det är väl talat, men låt oss nu odla vår trädgård” Voltaire PART OF THE NEW ENERGY MIX
CONFIDENTIAL 2 June 2016
”Det är väl talat, men låt oss nu odla vår trädgård” Voltaire PART OF THE NEW ENERGY MIX
Voltaire
@MinestoAB Minesto Charlotta Ekman COO Charlotta.ekman@minesto.com +46 762 065 080
POWER TO CHANGE THE FUTURE