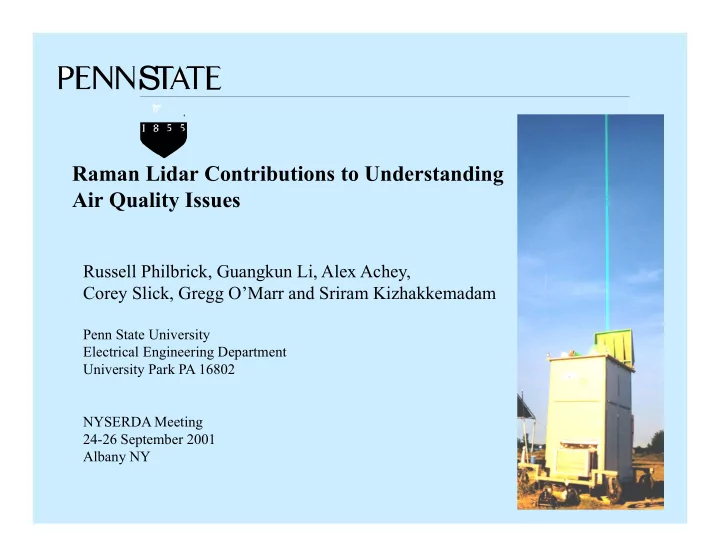

S Raman Lidar Contributions to Understanding Air Quality Issues Russell Philbrick, Guangkun Li, Alex Achey, Corey Slick, Gregg O’Marr and Sriram Kizhakkemadam Penn State University Electrical Engineering Department University Park PA 16802 NYSERDA Meeting 24-26 September 2001 Albany NY
Air Quality Research Goals • Investigate, understand and model the physical and chemical processes important in evolution of air pollution events • Identify the local and transport sources that contribute to increased concentrations of ozone and PM2.5 • Connect the sources of air pollution with population exposure and health effects • Develop and test models which fully predict the distribution of air pollutants to predict and test regulatory measures • Develop and improve the measuring techniques needed for process monitoring
Raman LIDAR Techniques – Raman lidar techniques provide valuable description of evolution of air pollution events. • The vibrational and rotational Raman lidar signals provide simultaneous profiles of meteorological data, ozone and measurements of airborne particulate matter. • We make use of 2 nd and 4 th harmonic generated laser beams of a Nd:YAG laser to provide both daytime and nighttime measurements. • The Raman scatter signals from vibrational states of water vapor and nitrogen provide robust profiles of the specific humidity in the lower atmosphere. • The temperature profiles are measured using the ratio of rotational Raman signals at 530 and 528 nm from the 532 nm (2 nd harmonic) beam. • Optical extinction profiles are determined from the measured gradients in each of the molecular profiles compared to the molecular scale height. • Wavelengths of 284 nm (nitrogen vibrational Raman), 530 nm (rotational Raman) and 607 nm (nitrogen vibrational Raman) are used for profiles of optical extinction. • The ozone profiles in the lower troposphere are measured using a DIAL analysis of the ratio of the vibrational Raman signals for nitrogen (284 nm) and oxygen (278 nm). • Several campaigns have provided this new and interesting 3-dimensional perspective for air pollution events.
Raman Scatter Raman Scattering Excited Electronic States Rayleigh Scatter 532 nm 2ndH Nd:YAG Log Cross Section Nitrogen 607 nm Water Vapor Virtual Energy Levels 660 nm 500 550 600 650 Rotational Levels Wavelength (nm) J V=2 J Vibration Energy Levels V=1 E J V=0
Measurements by LAPS Lidar Property Measurement Altitude Time Resolution Water Vapor 660nm/607nm 0 to 10 km Night – 1 min 294nm/285nm 0 to 3 km Day & Night – 1 min Temperature 528nm/530nm 0 to 10 km Night – 5 min Ozone 276nm/285nm 0 to 3 km Day & Night – 10 min Optical Extinction 285nm 0 to 5 km Day & Night – 10 min 530nm 0 to 10 km Night – 5 min 607nm 0 to 10 km Night – 5 min
Ozone Lidar Ratio of O 2 /N 2 Raman Signals
Ozone Profile
Water Vapor and Ozone – 10 July 2001 – 1200-1800 GMT (0800-1400 EDT) Balloon Release Local Noon Sudden Convection PSU LAPS Lidar profiles of water vapor and ozone during small brief episode on 10 July.
Balloon LIDAR
Balloon Ascent Lidar Integration Lidar profile provides more accurate picture of atmospheric structure. Example is taken from night of 31 July – 1 August 2001 during NARSTO- NE-OPS in Philadelphia.
LAPS Lidar Data 23 July 2001 – 1200-2400 UTC Local Noon Optical Extinction 284 nm Altitude (km) Ozone Water Vapor Specific Humidity
Optical Extinction and Water Vapor data show layered structure at the same time reported by UMD aircraft.
Variations of the nighttime boundary layer between 8PM and 8AM
Rotational Raman Temperature
Humidity control of extinction >80% relative humidity causes striking increase in extinction
Precursor Transport NARSTO-NE-OPS – Ozone suddenly increases when an elevated layer carrying precursor chemicals from upper mid-west region mixes with rising PBL at about 1PM local time. The water vapor provides a tracer of the elevated layer. In this case, the air pollution event appears to be triggered by the precursor materials that are temperature sensitive such as PAN (peroxyacetyl nitrate).
10 Hour Sequence of Ozone Afternoon rush hour provides sufficient NOx to reduce ozone concentration, then formation of nocturnal inversion cuts off supply of ozone transport to replace surface losses – results in storage aloft at night.
Relationship between Ozone and Particulate Matter
RAMAN LIDAR ! Raman lidar uses signal ratios and provides robust technique ! Several important properties can be routinely measured - water vapor temperature ozone optical extinction - 530 nm, 607 nm, 285 nm optical backscatter - 532 nm, 266 nm ! Time sequences provide description of the dynamics (1 min step and 5 min smooth for water vapor and extinction, 10 min step and 30 min smooth for ozone and temperature) ! Lidar measurements are capable of providing the data needed to test and validate models and replace balloon sondes
Summary Raman Lidar has been demonstrated to provide important of the 3-D characteristics of the meteorological and air quality properties: Ozone, Water Vapor, Optical Extinction, Temperature Combining the Raman Lidar data with Doppler radar provides a complete set of results for testing model predictions, evaluating dynamical processes (vertical and horizontal) and describing the meteorology of the lower atmosphere. Examples of preliminary results from the Raman Lidar data obtained as part of the NARSTO-NE-OPS project are shown. These results are expected to provide an important input to the 3-D picture of the local and regional processes controlling air pollution events.
Recommend
More recommend