
SLIDE 1
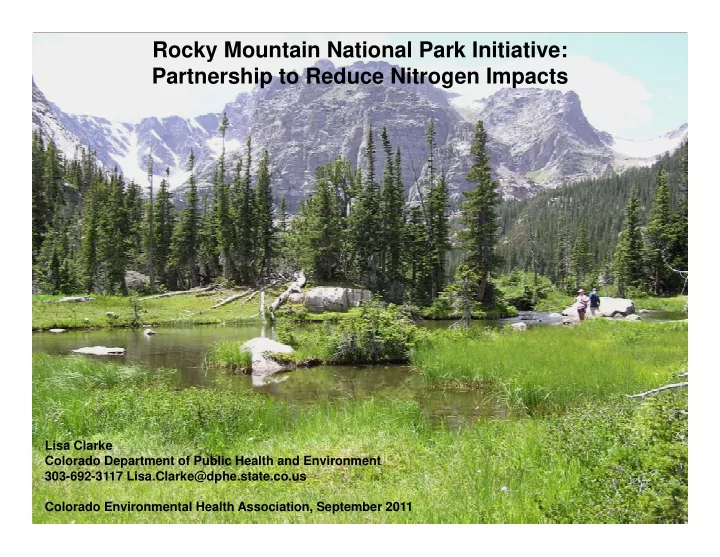
Rocky Mountain National Park Initiative: Partnership to Reduce Nitrogen Impacts
Lisa Clarke Colorado Department of Public Health and Environment 303-692-3117 Lisa.Clarke@dphe.state.co.us Colorado Environmental Health Association, September 2011