
SLIDE 1 1
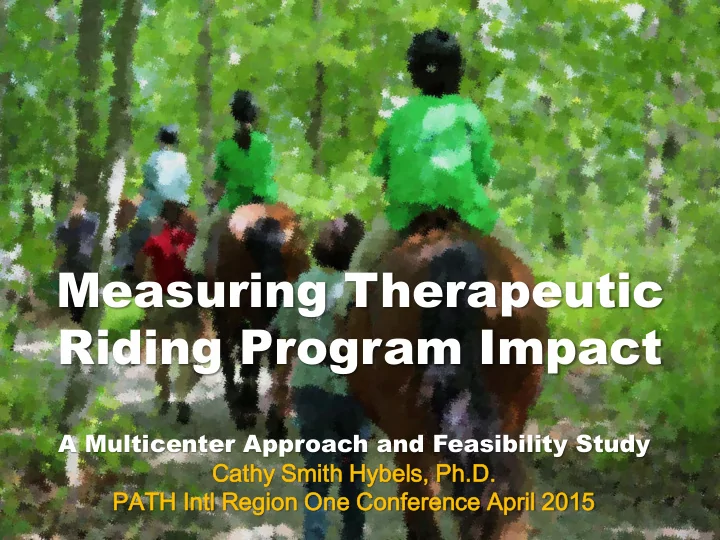
A Multicenter Approach and Feasibility Study Ca Cathy y Smith th Hy Hybels, s, Ph.D. D. PATH H Intl ntl Re Region One Co Confere erence nce April 2015
Measuring Therapeutic Riding Program Impact
Riding Program Impact A Multicenter Approach and Feasibility Study - - PowerPoint PPT Presentation
Measuring Therapeutic Riding Program Impact A Multicenter Approach and Feasibility Study 1 Ca Cathy y Smith th Hy Hybels, s, Ph.D. D. PATH H Intl ntl Re Region One Co Confere erence nce April 2015 Topics: TR Program Impact
A Multicenter Approach and Feasibility Study Ca Cathy y Smith th Hy Hybels, s, Ph.D. D. PATH H Intl ntl Re Region One Co Confere erence nce April 2015
Measuring Therapeutic Riding Program Impact
TR Program Impact Measuring Impact Collaboration Feasibility Study Results Expert panel
Topics:
TR Program Impact
in TR
We want to
Hybels 2015 From success defined as “how much we do”…
TR Program Impact
4# Participants
# Lessons
# Volunteer Hours $ value of volunteer time # Volunteers
# New Participants Types of TR programs
Hybels 2015 …to also include “how well we perform” and to answer “is anyone better off?”
5How well we perform
Impact on the Community Results-Based Accountability Research on TR EffectivenessIs Anyone Better Off?
Evidence-Based Practices
How much we do TR Program Impact
Hybels 2015 We want to advance accountability in TR at each of these levels
Participant TR program Instructor TR Center and the TR Industry 6TR Program Impact
Hybels 2015 Changing direction requires
7Measuring Impact
Hybels 2015 Measuring Impact Tools for measuring impact
Hybels 2015 Session Report
Product of a Collaborative Effort
Measuring Impact
Hybels 2015 Hor Horseman semanship ship Skill Skills
Mount Dismount Back up At halt--posture At halt--reins At halt--halt-walk transitions At walk--posture At walk—hold reins At walk—steer with reins At walk--walk-halt transitions At walk--half seat At trot/jog--posture At trot/jog--seated trot At trot/jog--half seat At trot/jog--posting At canter/lope Jump Tack Untack Groom Lead Horse SafetySup Suppo porting ting Skill Skills
Expressive Communication Attending to Task Balance Coordination Posture Follows direction Social interaction Safety Awareness Regulates Behavior 10Measuring Impact
Session Report
Identifies TR Skill Areas
Hybels 2015 Horsemanship Skills Uses Natural Aids: Uses hands, legs, seat, voice, ears, and eyes to effectively communicate with the horse
Horse Safety: Recognizes potentially unsafe or hazardous circumstances both mounted and unmounted and reacts accordingly.
approaching too close to another horse and directs horse to an open space in the arena.
11Session Report
Defines TR Skill Areas
Measuring Impact
Hybels 2015 Session Report
Tracks P Progress in Skill Areas
Horsemanship Skill Area Section
Measuring Impact
Hybels 2015 Session Goals (March/April):
1. 2. 3.Progress notes on goals for this session (Indicate progress and to what degree the goal was met) Recommended Future Goals:
1. 2. 3.Please note anything that could be helpful to know about this rider:
13Session Report
Tracks P Session Goals
Session Goals & Progress Notes SectionMeasuring Impact
Hybels 2015 Measuring Impact
14 Defines TR skill areas Tracks P skill progress over a year in several TR skill areas Tracks P progress on individual goals Designed by instructors for instructors Field tested Facilitates communication between TR instructors
areas—vulnerable to bias
data to determine program effectiveness
because there is no research to establish its credibility as an assessment tool
Session Report
As a Tool for Measuring Impact Hybels 2015 Goal Attainment Scaling (GAS) is a widely implemented and systematic goal setting & evaluation process that measures the extent to which a participant’s goal(s) is achieved
Assess P Baseline Performance in a TR Skill Area Identify Goal Define Expected Outcomes Assess goal attainment
Measuring Impact
TR Instructor TR Instructor & others TR Instructor Independent Rater Hybels 2015 participant
Deliver Instructionthe TR session to observe and assess performance in goal areas
16Measuring Impact
GAS Process
Hybels 2015 Measuring Impact
GAS Encourages:
Collaboration in Goal Setting
Hybels 2015 Measuring Impact
GAS Encourages:
Support Team Collaboration
Hybels 2015 Measuring Impact
GAS Requires:
SMART Goals
Hybels 2015 Measuring Impact
Goal Scale Development
Start with Defining Baseline Performance Hybels 2015 Measuring Impact
Goal Scale Development
Define the Expected Performance Hybels 2015 Measuring Impact
Goal Scale Development
Define the other possible levels Hybels 2015 Goal Scales In Use
This is what the Rater Sees Participant performs sitting trot down the long side Participant performs posting trot for less than half the long side Participant performs posting trot down the long side Participant performs posting trot for half the entire ring Participant performs posting trot for the entire ring Please check the box next to the description below that best describes the participant’s performance that you observed today: Please describe any circumstances present that you feel may have affected the participant’s performance: Hybels 2015 Less than expected Participant demonstrates posting trot for less than half the long side Expected Participant demonstrates posting trot down the long side 1 Better than expected Participant demonstrates posting trot for half the entire ring 2 Much better than expected Participant demonstrates posting trot for the entire ring 24
Measuring Impact
The independent rater selects the level that best matches the performance they observed How to interpret the ratingGoal Attainment Scales
How Scores Are Assigned Hybels 2015 Rating Goal Attainment Level Description
Less than expected Participant picks up the reins after a verbal cue, then immediately puts them down Expected Participant picks up the reins after a verbal cue and holds them for 1 minute, then puts them down 1 Better than expected Participant picks up the reins after a verbal cue and holds them for 2 minutes, then puts them down 2 Much better than expected Participant picks up the reins after a verbal cue and holds them for 3 minutes, then puts them down 25
Measuring Impact
TR Goal Attainment Scale Example #2
Hybels 2015 GAS Allows Aggregation of Scores to Help Answer “How Well Did We Do?”
26 5 10 15 20 25 30 Baseline/Much worse than expected progress Worse than expected progress Expected progress Better than expected progress Much better than expected progressGAS Score Frequency
GAS ScoreMeasuring Impact
Hybels 2015 GAS Results Help to Answer “Is Anyone Better Off?”
27 10 20 30 40 50 60Demonstrated Progress on goal(s) No Progress Demonstrated on goal(s) No GAS score
82%
14% 4%Measuring Impact
Hybels 2015 GAS Results Communicate the Skill Area Focus of TR Lessons
10 20 30 40 50 60 70 80 90 Mount Dismount Uses Natural Aids Halt Back Up Walk--overall Walk--half seat Steering 28Number of goals
TR Skills As Defined on the Session Report
Measuring Impact
Hybels 2015 Measuring Impact
GAS Results Reveal the Skill Area Focus of Different Instructors
Hybels 2015 Lesson horse issues P well-being Other issues
GAS Results Reveal Factors That May Have Potentially Limited Goal Attainment
30Support team issues
Measuring Impact
Hybels 2015 GAS as a Tool for Measuring Impact
Measuring Impact
31 Client-specific measures Sensitive measures Low cost Allows aggregation of scores Established credibility & validity Enhances team collaboration Flexible--accommodates multiple goals, weighted goals, group goals Implementation can be scaled Intuitive process
training, and experience to produce good GAS scales
can be an issue
potentially be intrusive in lessons
Hybels 2015 TRAIN Tool Key Attributes Session Report GAS
Definitions of common TR terms Systematically tracks instructors’ notes on p progress Describe what skills are being taught in TR Intended for sharing with p’s, families, care providers, and volunteers Provides independent assessments of p goal attainment Produces numerical performance measures in TR skill areas 32Session Reports & GAS: Complimentary and Synchronized Tools
Measuring Impact
Hybels 2015 Why Collaborate?
that only emerge when there enough data points
learn & develop a new way of thinking
discussions of accountability Multicenter Collaboration
33 Hybels 2015 Therapeutic Riding Assessment of Impact Network = TRAIN
34Multicenter Collaboration
Hybels 2015 2014 TRAIN Member Centers
35Multicenter Collaboration
Hybels 2015 2014 TRAIN Member Center Attributes
36 All l are re premier ier accr credite ited cente tersMulticenter Collaboration
Hybels 2015 2014 TRAIN Feasibility Study Purpose
Feasibility Study
Hybels 2015 2014 Use of GAS at 4 TR Centers
10 instructors 2 TR Sessions 32 Goals 30 Raters 5 Instructors 4 TR Sessions 70 Goals 19 Raters 2 Instructors 3 TR Sessions 25 Goals 13 Raters 2 Instructors 4 TR Sessions 170 Goals 44 RatersTRAIN
Feasibility Study
Hybels 2015 19 TR instructors
13 TR sessions318 goal attainment scores 4 TR Centers 106 raters
2 TRAIN Meetings DropboxThe horses empowered…
Feasibility Study
Hybels 2015 Various Strategies For Using GAS Were Utilized at the 4 TR Centers and By Different Instructors
Approach Strategy Variant 1 Strategy Variant 2 Participant (p) inclusion Every p had a GAS goal Selected p’s had GAS goals Number of GAS goals/p 2 goals per p 1 goal per p GAS Goal variance Unique goal for each p Similar goals for all p’s GAS Goal originality Original Recycled/revised Instructor’s use of GAS One session Every session GAS Goal periods 6 weeks 12 weeks Expected p performance Rated on typical performance Rated on best performance 40Feasibility Study
Hybels 2015 Different TRC Approaches to Implementing GAS
TRAIN Member Center # Instructors Ave # Goals/Instructor # Raters Ave # Goals/RaterHigh Hopes 10 3.2 30 1.06 High Horses 5 14 17 3.68 Southern Vermont 2 12.5 13 1.92 UpReach 2 85 44 3.86 41 Wide range, yet all involved >50% of staff Greater experimentation with goal writing Less experimentation with goal writing Wider diffusion Experience as raters
Feasibility Study
Hybels 2015 Number of 2014 GAS Ratings Attained per Instructor
10 20 30 40 50 60 70 80 90 100 110 Number of Rated GAS Goals 42 TR InstructorsFeasibility Study
Hybels 2015 GAS Goal Horsemanship Skill Areas (part 1)
10 20 30 40 50 60 70 80 90 Mount Dismount Uses Natural Aids Halt Back Up Walk--overall Walk--half seat Steering 43Number of goals
TR Skills As Defined on the Session Report
Feasibility Study
Hybels 2015 Number of goals
TR Skills As Defined on the Session Report
Feasibility Study GAS Goal Horsemanship Skill Areas (part 2)
Hybels 2015 Observed Progress In Goal Areas*
*Caveat: data obtained from a proof of concept study
10 20 30 40 50 60 70 80 90Expected
Feasibility Study
Hybels 2015 On19%
raters reported that participants’ performances may have been negatively affected by extenuating circumstances
Feasibility Study
Hybels 2015 Lesson horse behaviors (27 goals/8%) P well-being (10 goals/3%) Other issues (27 goals/8%)
Factors Perceived by Raters as Having Potentially Limited Goal Attainment
47Support team issues (13 goals/4%)
Feasibility Study
Hybels 2015 raters felt that extenuating cir circumstances cumstances
may have had a positive effect on goal attainment.
Feasibility Study
Hybels 2015 48 Comparing Goal Area Focus at 2 TRCs
49 5 10 15 20 25 30 35 40 5 10 15 20 25 30 35 40Feasibility Study
Hybels 2015 Comparing the Goal Area Focus of 2 Instructors
50 Instructor A Instructor B 5 10 15 20 25 5 10 15 20 25Feasibility Study
Hybels 2015 Goal Attainment Score Distributions Across TR Centers
Center 1
Center 2
51Center 3
Center 4
Feasibility Study
Hybels 2015 GAS Score Distributions for 2 Instructors
Feasibility Study
Hybels 2015 Who Else Is Better Off?
53TRA TRAIN IN Member Center Member Centers s Repor eported ted Conversations Changed with… Feasibility Study
Hybels 2015 2015 TRAIN Focus
54TR programs transfer into other activities
TRAIN 2015
Hybels 2015 GAS-Lite
55TRAIN 2015
Participant: # of GAS goals: Goals this session #of weeks in session: Accompanied by: Type of lesson: Private Group Session start date: Click here to enter a date. Instructor: Lesson day: time: Goal assessment date: Click here to enter a date. Horse: TR Center: Choose an item. Rater: Does the participant (or family or care provider) have a session goal? Yes No Don’t know If yes, what is their goal? Baseline Performance Expected Outcome Instructor: Please clarify whether the rater should assess best or typical performance Goal Attainment Rater: please check one box below Variance Rater: if goal attainment differs from the expected outcome, describe how it differs below Less than baseline Same as baseline Partially achieved As expected A little better Much Better Rater: Please describe any circumstances present that you feel may have affected the participant’s performance: Horsemanship Skills (Please check the appropriate box(es) below to indicate the most relevant goal skill area(s)) Mount Backup Trot/jog-sit Jump Groom Dismount Walk-overall Trot/jog-half seat Horse Safety Lead Uses Natural Aides Walk-half-seat Trot/jog-post Tack Other: Halt Walk-post Canter/lope Un-Tack Other: Supporting Skills (Please check the appropriate box(es) below to indicate the most relevant goal skill area(s)) Attends to task Correct posture Confidence Social interaction Manages sensory input Balance Expressive communication Joy Adaptability Regulates behavior Coordination Problem solving Safety awareness Follows direction Other: How do you anticipate this skill might carry over or transfer to the participant’s activities of daily living? Support Team Instructions Helmet: Note: All lessons may include a trail ride Definitions: Precautions: Special Mount/Dismount Instructions: Special side walker verbal or physical prompts &/or assists: Special leader assists: TRAIN 2015 GAS Lite v1.2 Hybels 2015 TRAIN Expert Panel
Center
Program
Center
56Expert Panel
Hybels 2015 Thank you!
For more information, contact: 57 Cathy Smith Hybels, Ph.D. Therapeutic Riding Assessment of Impact Network (TRAIN) chybels@sover.net Hybels 2015 Previous project reports and TRAIN forms can be found on the High Horses Therapeutic Riding Program website (www.highhorses.org) or by following the links below: Measuring Outcomes at High Horses: Pilot Study Results Measuring Outcomes at High Horses: 2013 Feasibility Study Results Getting WISE at High Horses and Measuring the Outcomes: 2013 Pilot Study Results Building Capacity for Evaluating Outcomes in Therapeutic Riding: A Collaborative Approach Building Capacity for Evaluating Outcomes in Therapeutic Riding Using GAS and a Collaborative Approach: A Summary of the Lessons Learned TRAIN GAS Rater Form v2.0 TRAIN GAS Lite Form v1.2