Richtlinien zur Publikation von B AYES -Schtzungen R einhard V - - PDF document

richtlinien zur publikation von b ayes sch tzungen
SMART_READER_LITE
LIVE PREVIEW

Richtlinien zur Publikation von B AYES -Schtzungen R einhard V - - PDF document

E BERHARD K ARLS U NIVERSITT Eberhard-Karls-Universitt UKT T BINGEN Universittsklinikum Tbingen Richtlinien zur Publikation von B AYES -Schtzungen R einhard V ONTHEIN Institut fr Medizinische Biometrie, Tbingen


slide-1
SLIDE 1

1

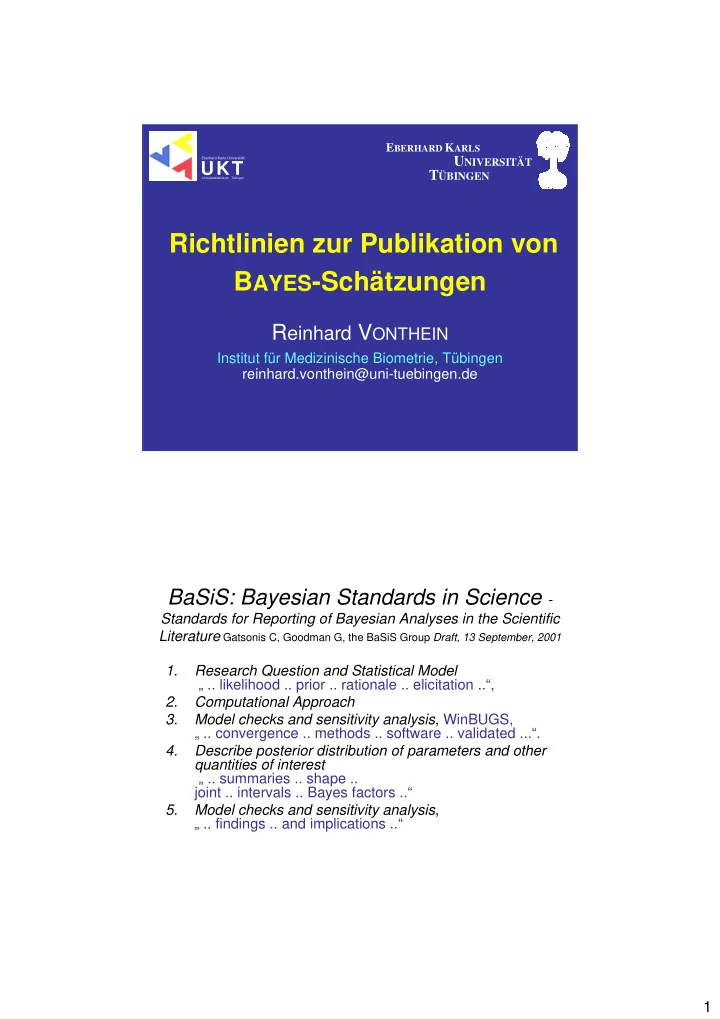
Richtlinien zur Publikation von BAYES-Schätzungen

Reinhard VONTHEIN

Institut für Medizinische Biometrie, Tübingen reinhard.vonthein@uni-tuebingen.de

Eberhard-Karls-Universität

UKT

Universitätsklinikum Tübingen

EBERHARD KARLS

UNIVERSITÄT TÜBINGEN

BaSiS: Bayesian Standards in Science -

Standards for Reporting of Bayesian Analyses in the Scientific Literature Gatsonis C, Goodman G, the BaSiS Group Draft, 13 September, 2001 1. Research Question and Statistical Model „ .. likelihood .. prior .. rationale .. elicitation ..“, 2. Computational Approach 3. Model checks and sensitivity analysis, WinBUGS, „ .. convergence .. methods .. software .. validated ...“. 4. Describe posterior distribution of parameters and other quantities of interest „ .. summaries .. shape .. joint .. intervals .. Bayes factors ..“ 5. Model checks and sensitivity analysis, „ .. findings .. and implications ..“

slide-2
SLIDE 2

2

Seven items were identified for inclusion when reporting a Bayesian analysis of a clinical trial.

Sung L, Hayden J, Greenberg ML, Koren G, Feldman BM, Tomlinson GA. Journal of Clinical Epidemiology 2005;58:261-268 21 Items proposed, 23 experts answered, 1. prior distribution specification 2. prior distribution justification 3. prior distribution sensitivity analysis 4. statistical model 5. analytic method 6. results’ central tendency 7. results’ variance 40 studies reported a median 5 of the 7 items (κ=0.76)

Guidance for the Use of Bayesian Statistics in Medical Device Clinical Trials - Draft Guidance

for Industry and FDA Staff. distributed for comments only May 23, 2006 1. Introduction 2. The Least Burdensome Approach 3. Foreword, WinBUGS, „ .. submit .. data .. programs used .. electronically“, „ .. discuss .. design, models, .. prior .. with FDA before the study..“. 4. Bayesian Statistics 5. Planing a Bayesian Clinical Trial, P(H0 | y), min & max n, α, β, E(n), P(H0) 6. Analysing a Bayesian Clinical Trial, (next slide) 7. Post-Market Surveyance, „ ..update information .. if .. exchangeability ..“ 8. References 9. Appendix, (next slides)

slide-3
SLIDE 3

3

Guidance for the Use of Bayesian Statistics in Medical Device Clinical Trials - Draft Guidance

for Industry and FDA Staff. distributed for comments only May 23, 2006

  • 6. Analysing a Bayesian Clinical Trial

„ .. posterior mean and standard deviation, .. graphic representation ..“, P(H0 | y), „ .. type I and II error rates of your proposed hypothesis test. .. „ differentiate HPD, central and other credible intervals, predict outcome, e.g. missing data Model checking (for exchangeability): Bayesian p-value, Bayesian deviance Deciding when to stop, Interim analysis ( ... ) specify which of posterior probability, predictive distribution, decision analysis, „ .. calculate the probability of a type I error through simulations before accepting a method. ..“

Guidance for the Use of Bayesian Statistics in Medical Device Clinical Trials - Draft Guidance

for Industry and FDA Staff. distributed for comments only May 23, 2006

  • 9. Appendix

9.1 Suggested Information to Submit to FDA „ .. all prior information you will use .. . Criterion for success ..“ „ .. sample size .. , .. simulate data ..“ P(H0 | y, n, θ ) „Frequentist power tables“ (c.f. 9.4), simulate monitoring Predictive probability a priori „ .. simulate data .. leave blank the .. data ..“ P(H0 | θ ), „ .. adding a constant to the study variance until the prior predictive probability of the claim is relatively low.“ „Program code .. prior data .. data .. code used ..“ „Effective sample size .. n*V1/V2 .. – n = number of patients ‘‘borrowed‘‘ ..“

slide-4
SLIDE 4

4

Guidance for the Use of Bayesian Statistics in Medical Device Clinical Trials - Draft Guidance

for Industry and FDA Staff. distributed for comments only May 23, 2006 9.3 Calculations „ .. check .. convergence .. CODA .. posterior distribution is

  • proper. .. . FDA routinely checks the calculations .. e.g. for

convergence .. submit data and any programs .. electronically.“ 9.4 Simulations to Obtain Operating Characteristics „ .. planing stage .. parameters are fixed at the borderline value for which the device should not be approved. The proportions of successful trials .. type I error rate. .. several likely scenarios .. expected sample size .. type II error rate .. parameters fixed at plausible values for which the device should be approved. .. type I error .. specific to a submission .. reduce that rate .. increase .. probability that defines a succesful trial .. discount the prior .. reduce the number of interim analyses .. “

Beispiel

Statistical Methods Scores were assumed to follow a binomial distribution with logits of scoring probabilities explained by the following factors: time, treatment, their interaction, and random subject-specific effects. 95% credible intervals (C.I.) for differences of medians were estimated by the Markov chain Monte Carlo method (WinBUGS 1.4.1, Medical Research Council and Imperial College (Spiegelhalter et al. 2004)) with uninfluential priors (Gelman, 2006). Supporting online material Patients were assumed to be exchangeable as were centers. Scores are known to be repeatable to within 3 points (et al.). Therefore prior SD was set to a value equivalent to 3 points at the median score. An If-Then-Diagram of posterior mean of the median difference

  • f differences by prior SD

showed considerable influence

  • nly for prior SDs equivalent to

less than 1 point. Now prior information was worth about

  • ne observation. ...

The effect was assumed to follow a normal distribution with mean 0 and SD 3. ...

slide-5
SLIDE 5

5

Beispiel

Supporting online material The WinBUGS code is

model { for(i in 1:92){ # Inhaltliches Modell Y1[i] ~ dbin(p1[i],65);pm1[i] <- 65*p1[i]; Y2[i] ~ dbin(p2[i],65);pm2[i] <- 65*p2[i]; logit(p1[i]) <- my0 + xi*my[i] - 0.5*tdiff + (treatment[i]-1.5)*bdiff - 0.5*(treatment[i]-1.5)*dd; logit(p2[i]) <- my0 + xi*my[i] + 0.5*tdiff + (treatment[i]-1.5)*bdiff + 0.5*(treatment[i]-1.5)*dd; } # Random nested Effects for(i in 1:46) { my[i] ~ dnorm(0,tau); } # RUL for(i in 47:92) { my[i] ~ dnorm(0,tau); } # BIF # a priori Verteilungen tau ~ dgamma(0.5,0.5); # chi^2 with 1 df sigma <- abs(xi)/sqrt(tau); xi ~ dnorm(0,tau.xi); # cauchy tau.xi <- pow(prior.scale, -2); prior.scale <- 1; dd ~ dnorm(0,1); tdiff ~ dnorm(0,1); bdiff ~ dnorm(0,1); my0 ~ dnorm(0,1); # interessanter Output m1 <- 65*exp(my0-0.5*tdiff)/(1+exp(my0-0.5*tdiff)); m2 <- 65*exp(my0+0.5*tdiff)/(1+exp(my0+0.5*tdiff)); dt <- m2-m1; rul1 <- 65*exp(my0-0.5*bdiff-0.5*tdiff+0.25*dd)/(1+exp(my0-0.5*bdiff-0.5*tdiff+0.25*dd)); bif1 <- 65*exp(my0+0.5*bdiff-0.5*tdiff-0.25*dd)/(1+exp(my0+0.5*bdiff-0.5*tdiff-0.25*dd)); rul2 <- 65*exp(my0-0.5*bdiff+0.5*tdiff-0.25*dd)/(1+exp(my0-0.5*bdiff+0.5*tdiff-0.25*dd)); bif2 <- 65*exp(my0+0.5*bdiff+0.5*tdiff+0.25*dd)/(1+exp(my0+0.5*bdiff+0.5*tdiff+0.25*dd)); ww <- bif2-bif1-(rul2-rul1); } inits list() data list(treatment=c(1, 1, 1, 1, 1, 1, 1, 1, 1, 1, 1, 1, 1, 1, 1, 1, 1, 1, 1, 1, 1, 1, 1, 1, 1, 1, 1, 1, 1, 1, 1, 1, 1, 1, 1, 1, 1, 1, 1, 1, 1, 1, 1, 1, 1, 1,2, 2, 2, 2, 2, 2, 2,

2, 2, 2, 2, 2, 2, 2, 2, 2, 2, 2, 2, 2, 2, 2, 2, 2, 2, 2, 2, 2, 2, 2, 2, 2, 2, 2, 2, 2, 2, 2, 2, 2, 2, 2, 2, 2, 2, 2), Y1=c(16, 22, 24, 32, 27, 32, 29, 31, 23, 36, 32, 24, 36, 20, 37, 26, 30, 32, 37, 31, 28, 24, 31, 31, 34, 28, 24, 36, 27, 28, 34, 27, 39, 20, 16, 24, 23, 17, 22, 29, 33, 27, 21, 39, 34, 21, 20, 20, 26, 39, 18, 29, 37, 19, 27, 28, 32, 33, 17, 35, 33, 30, 35, 31, 33, 28, 22, 34, 30, 22, 38, 27, 20, 27, 22, 20, 42, 36, 25, 28, 22, 34, 17, 27, 19, 24, 32, 26, 28, 30, 30, 23), Y2=c(7, 19, 20, 32, 12, 30, 24, 22, 14, 23, 13, 14, 16, 6, 23, 18, 22, 26, 30, 26, 10, 16, 21, 23, 18, 2, 4, 5, 23, 19, 23, 23, 32, 13, 15, 16, 16, 17, 14, 12, 25, 20, 16, 8, 15, 15, 17, 24, 15, 16, 15, 23, 27, 17, 15, 19, 36, 18, 12, 22, 22, 23, 9, 13, 15, 19, 7, 20, 7, 9, 20, 6, 12, 26, 13, 19, 35, 23, 18, 18, 20, 24, 9, 9, 14, 15, 12, 27, 16, 30, 14, 8) )

Beispiel

Supporting online material After 10000 iterations of burn in, 100000 iterations were used as a sample from the posterior distribution. 2.5%- and 97.5%-quantiles were used as limits of central posterior credible intervals. Convergence was verified by plots of the chain.

slide-6
SLIDE 6

6

Konvergenz und Mischen

beta[1,1] Ketten 1:2 Iteration 1 200 400 600

  • 1.5
  • 1.0
  • 0.5

0.0 0.5 1.0

a-posteriori-Dichten

  • 4
  • 3
  • 2
  • 1

1 0.0 0.5 1.0 1.5 2.0 2.5 3.0

βj, 1 f (βj,1 | y) β10,1 β9,1 β8,1 β1,1 β3,1 β2,1 β4,1 β5,1 β6,1

10 31 = = ν σ β

Kontrolle - SCDVP22

slide-7
SLIDE 7

7

Wenn-Dann-Diagramm

Vonthein R. (2002). Bayesians should use if-then-diagrams. XXIst IBC 2002 Freiburg/Germany July 21-26, 136 Carlin, B. P., Chib, M. K. (1995). Bayesian model choice via Markov chain Monte Carlo. JRSS B 57:473-484

0.1 0.2 0.3 0.4 0.5 0.6 0.7 0.8 0.9 1

P( β1 = 0 ) a posteriori

.1 .2 .3 .4 .5 .6 .7 .8 .9 1

P( β1 = 0 ) a priori

10 31 = = ν σ β 100 10 = = ν σ β

Beispiel

Statistical Methods A net sample size of 45 patients in each group was calculated in advance (RV). Superiority by an odds ratio (OR) of 3.78 (et al.) would have been detected in Fisher’s exact test with a power of 0.8 at the 0.05 level of type I error rate. The drop-out rate was assumed to be 10%.

slide-8
SLIDE 8

8

Projektvorschlag

  • Frequentistische Fallzahlplanung für

einige BAYES-Tests

  • DFG / EU bezahlt dafür Studien-Statistiker

mehr als sonst und gesondert

  • Simulation und Auswertung 2 bis 3

aufeinander aufbauender Studien (Pilot, PoC, Dosisfindung, Phase III, Phase IV)