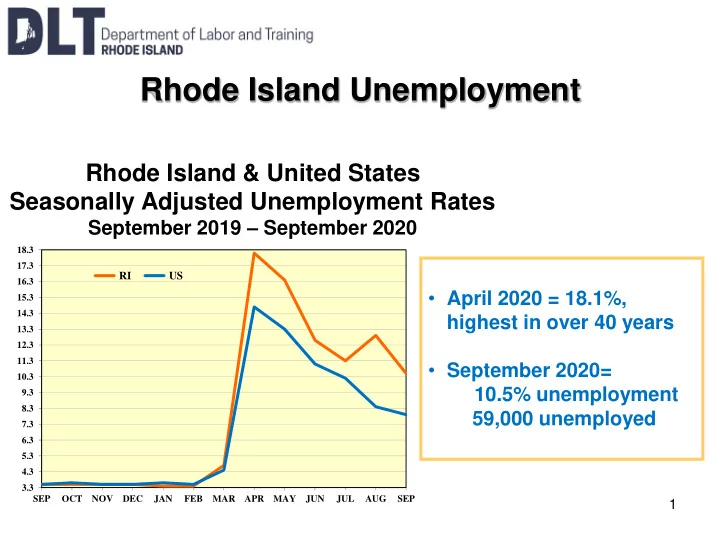

Rhode Island Unemployment Rhode Island & United States Seasonally Adjusted Unemployment Rates September 2019 – September 2020 18.3 17.3 RI US 16.3 • April 2020 = 18.1%, 15.3 14.3 highest in over 40 years 13.3 12.3 11.3 • September 2020= 10.3 10.5% unemployment 9.3 8.3 59,000 unemployed 7.3 6.3 5.3 4.3 3.3 SEP OCT NOV DEC JAN FEB MAR APR MAY JUN JUL AUG SEP 1
Seasonally Adjusted Unemployment Rates Seasonally Adjusted Unemployment Rates September 2019 to September 2020 18.5 17.5 16.5 15.5 14.5 13.5 12.5 11.5 Percent 10.5 9.5 8.5 7.5 6.5 5.5 4.5 3.5 2.5 Sep Oct Nov Dec Jan Feb Mar Apr May Jun Jul Aug Sep US 3.5 3.6 3.5 3.5 3.6 3.5 4.4 14.7 13.3 11.1 10.2 8.4 7.9 RI 3.5 3.5 3.5 3.5 3.4 3.4 4.7 18.1 16.4 12.6 11.3 12.9 10.5 MA 2.8 2.8 2.8 2.8 2.8 2.8 2.8 16.2 16.6 17.7 16.2 11.4 9.6 CT 3.7 3.8 3.8 3.8 3.7 3.8 3.4 8.3 9.6 10.1 10.2 8.1 7.8 2
Rhode Island Jobs Recovered February 2020 – September 2020 Overall Percent of Employment Change from Change from Change from Jobs Recovered Feb-20 Apr-20 Sep-20 Feb-Apr '20 Apr-Sep '20 Feb-Sep '20 from Apr '20 Total Nonfarm 508.4 410.3 468.0 -98.1 -19.3% 57.7 14.1% -40.4 -7.9% 58.8% Total Private 442.4 346.0 404.3 -96.4 -21.8% 58.3 16.8% -38.1 -8.6% 60.5% Natural Resources & Mining 0.2 0.2 0.3 0.0 0.0% 0.1 50.0% 0.1 50.0% * Construction 20.3 17.7 18.6 -2.6 -12.8% 0.9 5.1% -1.7 -8.4% 34.6% Manufacturing 39.4 37.2 38.7 -2.2 -5.6% 1.5 4.0% -0.7 -1.8% 68.2% Wholesale Trade 16.8 16.1 16.1 -0.7 -4.2% 0.0 0.0% -0.7 -4.2% 0.0% Retail Trade 48.5 39.1 45.6 -9.4 -19.4% 6.5 16.6% -2.9 -6.0% 69.1% Transportation & Utilities 13.2 10.3 10.2 -2.9 -22.0% -0.1 -1.0% -3.0 -22.7% -3.4% Information 5.5 5.3 5.3 -0.2 -3.6% 0.0 0.0% -0.2 -3.6% 0.0% Financial Activities 35.8 33.8 35.7 -2.0 -5.6% 1.9 5.6% -0.1 -0.3% 95.0% Professional & Business Services 68.4 57.3 62.9 -11.1 -16.2% 5.6 9.8% -5.5 -8.0% 50.5% Educational Services 27.0 22.8 26.3 -4.2 -15.6% 3.5 15.4% -0.7 -2.6% 83.3% Health Care & Social Assistance 83.9 68.1 78.7 -15.8 -18.8% 10.6 15.6% -5.2 -6.2% 67.1% Arts, Entertainment & Recreation 8.2 3.3 5.9 -4.9 -59.8% 2.6 78.8% -2.3 -28.0% 53.1% Accommodation & Food Services 53.0 18.8 40.9 -34.2 -64.5% 22.1 117.6% -12.1 -22.8% 64.6% Other Services 22.2 16.0 19.1 -6.2 -27.9% 3.1 19.4% -3.1 -14.0% 50.0% Government 66.0 64.3 63.7 -1.7 -2.6% -0.6 -0.9% -2.3 -3.5% -35.3% Federal Government 11.3 11.3 12.3 0.0 0.0% 1.0 8.8% 1.0 8.8% * State Government 20.7 21.4 19.5 0.7 3.4% -1.9 -8.9% -1.2 -5.8% * Local Government 34.0 31.6 31.9 -2.4 -7.1% 0.3 0.9% -2.1 -6.2% 12.5% *Employment sectors did not lose employment between February and April. 3
Rhode Island & United States Rhode Island Seasonally Adjusted Unemployment Rates September 2020 September 2019 – September 2020 Labor Force 561,000 OTM +20,600 OTY +4,600 Employed 502,000 OTM +31,100 OTY -35,000 Unemployed 59,000 OTM -10,500 OTY +39,500 Un Rate 10.5% OTM - 2.4 OTY +7.0 4
Initial Claims Filed by Occupational Goup Claims Filed March 12 thru October 10, 2020 Percent of Median Average Initial Initial Percent Median 40-Hour Weekly Claims Claims Occupational of Wage Weekly Benefit Filed Filed Workforce Workforce Hourly Wage Amount Occupational Group Total 228,490 --- 483,580 47.2% $21.24 $850 $425 Lower Wage Jobs, Total 139,593 61.1% 271,660 51.4% --- --- --- Food Preparation & Serving Related Occupations 32,646 14.3% 49,120 66.5% $12.58 $503 $252 Personal Care & Service Occupations 11,877 5.2% 10,930 108.7% $13.32 $533 $266 Building & Grounds Cleaning & Maintenance Occupations 6,247 2.7% 16,950 36.9% $14.55 $582 $291 Sales & Related Occupations 18,426 8.1% 46,180 39.9% $15.13 $605 $303 Healthcare Support Occupations 7,308 3.2% 24,240 30.1% $15.49 $620 $310 Transportation & Material Moving Occupations 15,837 6.9% 30,880 51.3% $15.90 $636 $318 Production Occupations 16,391 7.2% 29,100 56.3% $18.00 $720 $360 Office & Administrative Support Occupations 30,861 13.5% 64,260 48.0% $20.06 $802 $401 Mid Wage Jobs, Total 33,206 14.5% 95,880 34.6% --- --- --- Protective Service Occupations 2,090 0.9% 12,950 16.1% $22.42 $897 $448 Installation, Maintenance, & Repair Occupations 5,474 2.4% 16,370 33.4% $23.29 $932 $466 Community & Social Service Occupations 3,101 1.4% 9,050 34.3% $24.17 $967 $483 Construction & Extraction Occupations 6,646 2.9% 17,090 38.9% $24.97 $999 $499 Arts, Design, Entertainment, Sports, & Media Occupations 4,455 1.9% 7,640 58.3% $27.44 $1,098 $549 Education, Training, & Library Occupations 11,440 5.0% 32,780 34.9% $31.37 $1,255 $599 Higher Wage Jobs, Total 45,778 20.0% 115,960 39.5% --- --- --- Business & Financial Operations Occupations 5,718 2.5% 30,320 18.9% $36.03 $1,441 $599 Legal Occupations 552 0.2% 3,760 14.7% $36.83 $1,473 $599 Life, Physical, & Social Science Occupations 1,858 0.8% 3,600 51.6% $37.08 $1,483 $599 Healthcare Practitioners & Technical Occupations 10,579 4.6% 33,940 31.2% $38.85 $1,554 $599 Computer & Mathematical Occupations 3,168 1.4% 14,510 21.8% $41.16 $1,646 $599 Architecture & Engineering Occupations 2,554 1.1% 8,870 28.8% $42.29 $1,692 $599 Management Occupations 21,349 9.3% 20,960 101.9% $60.87 $2,435 $599 Source: Department of Labor and Training, Labor Market Informatin Division 5 Unemployment Insurance Administrative Records Occupational Employment Survey
Recommend
More recommend