
SLIDE 1
04/01/13 1
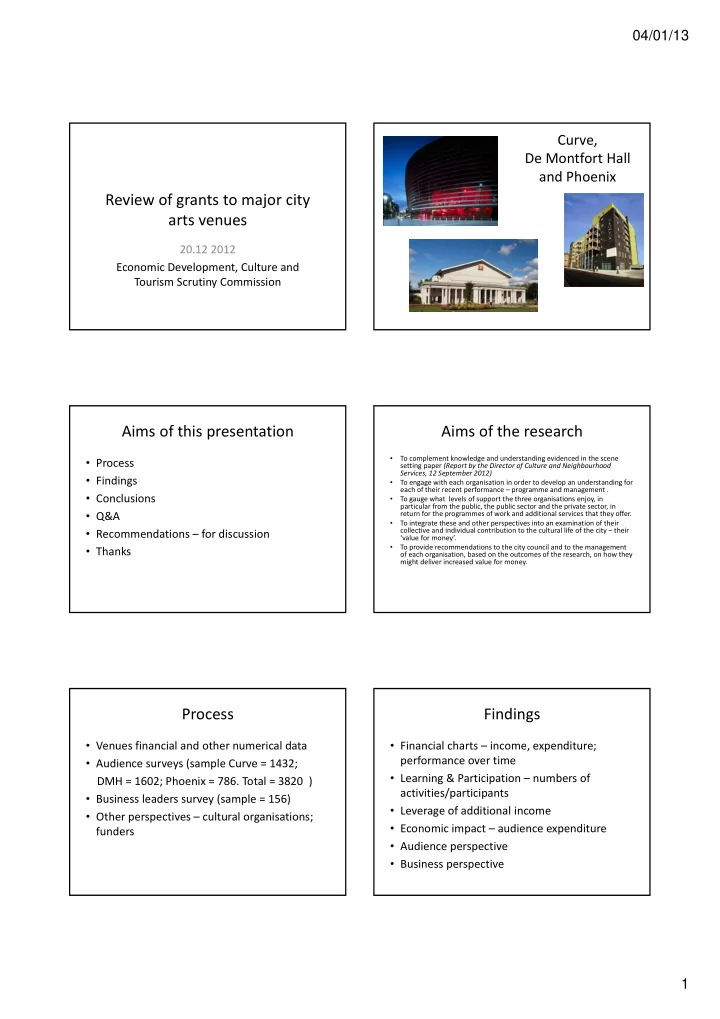
Review of grants to major city arts venues
20.12 2012 Economic Development, Culture and Tourism Scrutiny Commission
Curve, De Montfort Hall and Phoenix
Aims of this presentation
- Process
- Findings
- Conclusions
- Q&A
- Recommendations – for discussion
- Thanks
Aims of the research
- To complement knowledge and understanding evidenced in the scene
setting paper (Report by the Director of Culture and Neighbourhood Services, 12 September 2012)
- To engage with each organisation in order to develop an understanding for
each of their recent performance – programme and management .
- To gauge what levels of support the three organisations enjoy, in
particular from the public, the public sector and the private sector, in return for the programmes of work and additional services that they offer.
- To integrate these and other perspectives into an examination of their
collective and individual contribution to the cultural life of the city – their ‘value for money’.
- To provide recommendations to the city council and to the management
- f each organisation, based on the outcomes of the research, on how they
might deliver increased value for money.
Process
- Venues financial and other numerical data
- Audience surveys (sample Curve = 1432;
DMH = 1602; Phoenix = 786. Total = 3820 )
- Business leaders survey (sample = 156)
- Other perspectives – cultural organisations;
funders
Findings
- Financial charts – income, expenditure;
performance over time
- Learning & Participation – numbers of
activities/participants
- Leverage of additional income
- Economic impact – audience expenditure
- Audience perspective
- Business perspective