
SLIDE 1
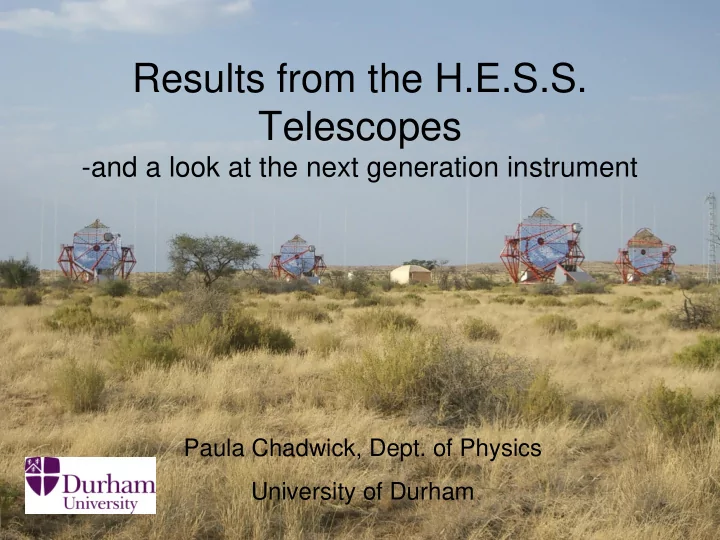
Results from the H.E.S.S. Telescopes
- and a look at the next generation instrument
Results from the H.E.S.S. Telescopes -and a look at the next - - PowerPoint PPT Presentation
Results from the H.E.S.S. Telescopes -and a look at the next generation instrument Paula Chadwick, Dept. of Physics University of Durham The Plan Some background information Recent H.E.S.S. results The Galactic Plane survey
– The Galactic Plane survey – The Galactic Ridge – Dark matter searches – Starburst Galaxies – The PKS2155-30 flare and quantum gravity
“One day in 1953, Prof Blackett was visiting Harwell....hearing of our work
as 1948 he had shown that there should be a contribution to the light of the night sky, amounting to about 10 -4 of the total, due to Cherenkov radiation produced in the upper atmosphere from the general flux of cosmic rays. ...... Blackett was only with us a few hours, and neither he nor any of us ever mentioned the possibility of pulses of Cherenkov light, from EAS. It was a few days later that it occurred to Galbraith and myself that such pulses might exist and be detectable.” John Jelley, in „Very High Energy Gamma Ray Astronomy, ed. K.E. Turver, NATO ASI Proc. 199 (1986)
Largest mirror
High-speed light detector Amplifier plus electronics
Gamma ray Hadronic Cosmic Ray 400m Image seen by a telescope from Jamie Holder
Stolen from Jim Hinton & Jamie Holder
pattern
threshold
the background Imaging Atmospheric Cherenkov Technique
Excellent source location Very large effective area Cannot observe during full moon Energy threshold (and collection area) increase with zenith angle. IACTs are pointing instruments Clouds are bad!
From Rene Ong
HAWC
M-PIK Heidelberg; Humboldt University, Berlin; University of Hamburg; Ruhr University, Bochum; Landessternwarte Heidelberg; Tübingen University; Erlangen-Nürnberg University LLR Ecole Polytechnique; LPNHE; APC College de France; University of Grenoble; CESR Toulouse; CEA Saclay; Observatoire de Paris-Meudon; LPTA Montpellier; LAPP Annecy Durham University; University of Leicester Dublin Institute for Advanced Studies Polish Academy of Sciences (Astronomical Center & Institute of Nuclear Physics); Jagiellionian University; Nicolaus Copernicus University Charles University, Prague Yerevan Physics Institute, Armenia University of Namibia North-Western University, South Africa University of Adelaide, Australia University of Innsbruck, Austria University of Stockholm, Sweden
Energy Threshold 100 GeV Energy Resolution 15% Field of View ~5º Angular Resolution 0.05º-0.1º Pointing Accuracy ~10 arcsec Signal Rate ~55/min (Crab Like) Sensitivity: 1 Crab in 30 sec 0.01 Crab in 50h
(All at zenith)
Unidentified 31 HBL 29 PWN 28 IBL 4 Shell SNRs 14 LBL 4 Binaries 5 FRI 2 Clusters/WR 4 Starburst Galaxies 2 Diffuse 2 FSRQ 3
1 (!) Seyfert 2 1?
That comes to 130 – but it is subjective, and each category has a typical uncertainty of +/- 1
2005 - 2008
l ~ 275° l ~ 60°
(Vallée 2008)
Extended H.E.S.S. GPS -85° < l < 60° -3° < b < 3° Scan mode: 400 h Detected 50+ Galactic sources
ICRC 2007, DPG 2008, Gamma08
Point sources subtracted
GC molecular clouds Tsuboi et al. 1999
Aharonian et al., Nature, 439, 695 (2006)
Nicked from Werner Hofmann!
Radio Sgr A* Sgr A East SNR TeV H.E.S.S.
TeV cog: 7”±14”stat ±28”syst from Sgr A*
Aharonian et al., A&A, 425, 13 (2004)
Angular distribution of H.E.S.S. result consistent with a point source, once diffuse BG eliminated (16% of total emission). Assume a Gaussian centred on best-fit position lower limit to slope of distribution
Aharonian et al., PhRvL, 97, 22, id 221102 (2006)
10-13 10-12 10-11 0,1 1 10 E2F(E) [TeV/cm2s] E [TeV]
20 TeV Neutralino 20 TeV KK particle
proposed before H.E.S.S. data proposed based on early H.E.S.S. data
Bergström et al, Phys. Rev. Lett., 94, id. 131301 (2005)
Radio contours of Sgr A East (VLA) Previous H.E.S.S. best-fit centroid New H.E.S.S. best-fit centroid First H.E.S.S. result was compatible with Sgr A East, Sgr A* and PWN candidate G359.95-0.04. Using paraxial optical cameras on telescopes reduced pointing errors from 20 arcsec to 6 arcsec per axis. Sgr A East looks to be ruled
Aharonian et al., MNRAS, Dec 2009 (astro-ph 0911.191v2)
HST Image Has crossed Milky Way at least 10 times without being disrupted. Good candidate for substantial amount of DM – not much gas, so low CR background too. Handily, also off the Galactic Plane. Signal is expected to come from a region ~1.5 pc, much smaller than the H.E.S.S. PSF. Profile (NFW…) doesn‟t matter!
June 2006, 11 hours. Upper limit E > 250 GeV: 3.6 x 10⁻¹² cm-2s-1. (95% c.l.)
Aharonian et al., Astropart. Phys., 29, 55 (2008).
For core model, a lower limit for the B(1) mass of 500 GeV can be derived. 100h observation would enable the exclusion of much more pMSSM parameter space and all KK space for the core model
From Strasbourg Observatory
pMSSM KK Mass of system not well known, so this is assuming mass of 3 x 10⁸ solar masses.
Aharonian et al., Ap.J., 691, 175 (2009)
Sculptor Carina Sculptor (KK) H.E.S.S. Collaboration ArXiv:1012.5602
This is very hard to The ATIC experiment observed a peak in the electron spectrum between 300 and 800 GeV. Coupled with PAMELA excess, this has led to much speculation – e.g. dark matter, contribution from a local pulsar etc. Measuring electron spectrum with a VHE gamma-ray experiment is tough – electrons and gamma rays both produce pure electromagnetic showers. Have to use off-GP data and extensive simulations to derive an „electron likeness‟ parameter, .
Aharonian et al., Astron. Astrophys., 508, 561 (2009)
Overall electron flux is compatible with ATIC within errors, but H.E.S.S. data exclude presence of a pronounced peak in the electron spectrum, though an energy shift could be possible, so it cannot be definitively ruled out. However, it‟s hard to reconcile with a KK dark matter scenario.
Compulsory picture! Starburst galaxies = lots of star formation (in a small region) = lots of supernovae = lots of particle (proton) acceleration + lots of gas = lots of VHE gamma rays = confirmation of suspicions about galactic CRs (and maybe information about galaxy/star formation)
NOAO/AURA/NSF
D = 3.9 ± 0.4 Mpc SN rate ~ 10x Milky Way in starburst region Mean density of gas in starburst region almost 103 higher than MW Radio, thermal X-rays show hot, diffuse halo consistent with galactic wind Discovered by Caroline Herschel in 1783
Optical extent of galaxy Flux (E > 220 GeV): 5.5 ± 1.0stat ± 2.8sys x 10-13 cm-2s-1 ~ 0.3% Crab flux 119 hours of observation No evidence for variability CR density in starburst region ~ 2000x that near the Solar System, and ~ 1400 times that near the GC
Acero et al., Science, 326, 1080 (2009)
H.E.S.S. PSF
Flux (E > 100 MeV): 1.6 ± 0.5stat ± 0.3sys x 10-8 cm-2s-1 Flux (E > 100 MeV): 0.6 ± 0.4stat ± 0.4sys x 10-8 cm-2s-1 No evidence for variability in either object
Abdo et al., Ap. J. Lett., 709, L152 (2010)
LMC Milky Way NGC 253 M82
Gamma-ray luminosity best correlates with SN rate and the mass of gas in the galaxy – perhaps not surprising. BUT distribution of CRs is unlikely to be uniform – e.g. the GeV emission in LMC mostly comes from 30 Doradus and does not trace star formation & total gas mass.
Emission models depend on many different parameters – agreement looks better for M82 than for NGC 253. In M82, the smooth power law connection between Gev & TeV emission suggests the same process produces both. Relationship less clear for NGC 253.
– CR energy production in equilibrium with losses from nuclear collisions; – Measured gas density and SN rate; – Production spectrum E-2.1
expected
perfect „beam dump‟
~ 10x higher than in the Milky Way
with H.E.S.S. point source)
M82 NGC 253
Cea del Pozo et al., 2009 Fermi Symposium (astro-ph 0912.3497v2)
Assume protons (pion decay) gamma rays dominate In M82: exploit uncertainties in SN explosion rate & efficiency of CR generation. In NGC 253: exploit uncertainties in distance (2.5 Mpc has been quoted), diffusion timescales & cutoffs in the proton injection spectrum.
The most common VHE- emitting AGN are the high- frequency peaked blazars – where we are looking almost directly down the jet.
WOW!
In late July 2006, this AGN went crazy, and produced a burst that made the
11,000 gamma rays!
Broadly speaking (models vary), quantum gravity predicts an energy- dependence of the speed of light of the form:
2 2
p p
where Ep is the Planck Energy, 1.22 x 10¹⁹ GeV, and and are free parameters to be determined. The correction is expected to be very small, but Amelino-Camelia et al. (1998) suggested that these modifications can produce significant time delays with energy over cosmological distances. The absence of such energy dispersion sets limits on and . We can use the massive flare from PKS2155-304 to test this.
200-800 GeV > 800 GeV
Aharonian et al., astro-ph 0810.3475v1
The MCCF (left) looks quite exciting, with an apparent 20s lag for higher energy. However, when you do 10,000 simulations varying the flux points of the
peak distribution (right), you find an RMS of 28s and that simulations produce a negative delay for 21% of the time. The „lag‟ is therefore consistent with zero. < 17 for linear dispersion & < 7.3 x 10¹⁹ for quadratic dispersion
A similar test using a more sensitive maximum likelihood approach also yields limits of < 5.7 for linear dispersion & < 3.6 x 10¹⁶ for quadratic dispersion. H.E.S.S. Collaboration ArXiv:1101.3650
Distance kpc Mpc Gpc
Blazars SNR/PWN Binaries Radio Gal. Pulsed Starbursts Clusters
adapted by Hinton from Horan & Weekes 2003
Colliding Winds
Flux
Current CTA Sensitivity +Dark Matter GRBs Current instruments have passed the critical sensitivity threshold and reveal a rich panorama, but this is clearly only the tip of the iceberg
– Overlap with satellite-based instruments – Gamma-ray bursts – AGNs, microquasars
– Increase the „gamma-ray horizon‟ – Study of highly variable phenomena
– Crucial for understanding particle acceleration
– Reduce source confusion – Identification of structures e.g. in SNRs
– Improve survey sensitivity – Better control of background
Nicked from Jim Hinton! The best possible angular resolution anywhere above 100 keV
There may be an advantage to a dual-mirror system for the small telescopes - could provide a wide FoV for lower camera costs
Simon Blake, Durham University