
SLIDE 1
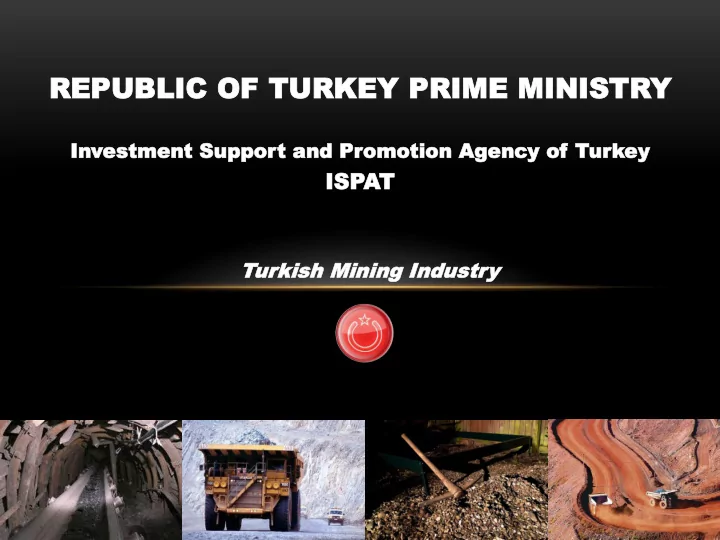
REPUBLIC REPUBLIC OF OF TURKEY TURKEY PRIME PRIME MIN MINISTR ISTRY
In Invest estmen ment S t Sup uppo port t an and Pr d Promo
- motion
REPUBLIC REPUBLIC OF OF TURKEY TURKEY PRIME PRIME MIN MINISTR - - PowerPoint PPT Presentation
REPUBLIC REPUBLIC OF OF TURKEY TURKEY PRIME PRIME MIN MINISTR ISTRY Invest In estmen ment S t Sup uppo port t an and Pr d Promo omotion tion Agen Agency of y of Tur urkey ey ISP ISPAT Tur urkish kish Mi Mining ning Ind
Investment Support and Promotion Agency of Turkey
Overview of Turkish Mining Industry Deep Dive on Priority Minerals of Turkish Mining Industry Incentives
Investment Support and Promotion Agency of Turkey
2
2.5% of the World Reserves
0.6% of the World Reserves
Number of Companies with Foreign Capital in Mining
SOURCE: USGS, MTA
Boron Salts Marble Na-Feldspar Bentonite Pumice Perlite Diatomite Barite Chromium Silver Gold Phosphate Copper Iron
72,00% 40,00% 19,14% 13,40% 9,74% 8,70% 4,81% 4,73% 1,44% 1,06% 0,67% 0,57% 0,29% 0,03%
2004 2005 2006 2007 2008 2009 2010 2011 2012 138 188 236 318 409 478 537 627 687
Investment Support and Promotion Agency of Turkey
2005 2006 2007 2008 2009 2010 2,181 2,732 3,528 4,904 4,471 4,784
Mining Sector Imports*
U.S $ Million 2005 2006 2007 2008 2009 2010 1,468 2,004 2,612 2,965 2,314 3,324
Mining Sector Exports*
U.S $ Million
Turkey strong in exports of
▪
Gold jewelry
▪
Natural stones and cement Major trade imbalances in
▪
Coal
▪
Copper
▪
Aluminum
2011, U.S. $ billions
*Raw Materials ,Ores and Concentrates +Includes all products in the value chain in addition to ores and concentrates
+
SOURCE: UN Comtrade; EtiBor; McKinsey&Company
Investment Support and Promotion Agency of Turkey
4
2005 2006 2007 2008 2009 2010 9,0 5,2 8,1 5,4
4,7
Growth of Output in Mining Sector %
2005 2006 2007 2008 2009 2010 5,166 6,214 8,105 10,172 9,210 10,250
Mining Sector Income
U.S $ Million
Global Crisis
Current Global Market Size (U.S $Billion) SOURCE: McKinsey&Company, State Planning Organization
Investment Support and Promotion Agency of Turkey
government policies on the investment attractiveness.
based on set of questions asked to mining companies on administration efficiency, labour issues, infrastructure, regulations.
10 20 30 40 50 60 70 67 66 53 46 44 39 27 26 15
December 2010, to further encourage professional mining;
acquisition with actual mining activity within a certain time frame.
investment plans be eliminated from the market.
is fairly structured and can take from 3 months to a year (depending on the geographical and specific localisation).
Policy potential Index
Score out of 100 SOURCE: Fraser Institute
Investment Support and Promotion Agency of Turkey
Turkey 12 Brazil Ontario 36
35 Kazakhstan 26 South-Africa 36 Russia 45 Zimbabwe 69 India 61 47 16 19 38 40 33 40 75 63 27 15 44 26 39 53 46 66 67 11 22 23 23 30 35 43 69 71 2009 2008 2010 2011 Notice
▪
PPI is a composite index that measures the effects of government policies on the investment attractively in mining industry
▪
The score is calculated as a normalized average of score based
asked to mining companies on administration efficiency, labour issues, infrastructure, regulations
▪
Historically, Turkey generally scored better than other main chromite producing countries Policy Potential Index by country Score out of 100 3
SOURCE: Nithia Capital Resources
Investment Support and Promotion Agency of Turkey
▪
Low sea freight rates in Turkey supported due to availability of excess container capacity on the Turkey – China route
▪
Overall processing cost increase in SA driven by power tariffs
Comparison of Turkish and South African CIF China cost base for comparable mines1 2010 cost comparison USD per metric tonne (real 2011) 2020 cost comparison USD per metric tonne (real 2011) 59 64 25 47 31 21 Mining costs Processing costs Royalties Inland transport Sea freight Other 158 4 34 3 194 6 55 2
1 Underground mines with ~1 million metric tonne
75 70 36 52 34 18 Mining costs Processing costs Royalties Inland transport Sea freight Other 172 5 41 4 241 10 66 2
Investment Support and Promotion Agency of Turkey
to 5 years
bureaucracy involved
licence acquisition with actual mining activity within a certain time frame. License traders with no real investment plans should, therefore, be eliminated from the market
from 3 to 12 months depending on the geographical and specific localisation but is generally considered reliable for genuine mining companies
internal factors
Russia South-Africa
legal uncertainties complicates mining rights process in South Africa India Turkey
SOURCE: Nithia Capital Resources
Investment Support and Promotion Agency of Turkey
Overview of Turkish Mining Industry Deep Dive on Priority Minerals of Turkish Mining Industry Gold Incentives
Investment Support and Promotion Agency of Turkey
10
Turkish gold reserves are around 700 tons (increased from 600 tons over the last 5 years, MTA alone discovered 45 tons in 2009). Probable reserves estimated around 1,700-6,500 tons1 making up for as high as 1/8th of globally proven reserves.
1 ODTU metallurgical engineer Ayhan Erler and MTA’s cooperative study concluded 1,700-6,500 tons of gold potential in 580 different locations in Turkey
2005 2006 2007 2008 2009 2010 2011 5 8 10 11 15 17 24
Gold Production of Turkey
Tons
+30%
Gold production in Turkey gained momentum following the legislation change facilitating exportation of unrefined gold.
SOURCE: MTA, Istanbul Gold Exchange, McKinsey&Company
2005 2006 2007 2008 2009 2010 2011
275 203 242 180 53 64 77 10 38 49 142 165 56 118 Import Export Tons
Investment Support and Promotion Agency of Turkey
11
Gold reserves Anatolia Minerals Koza Gold mine Eldorado Gold Potential gold-silver reserves
Turkish Gold Reserves
Ovacık Masra Çukuralan… Efemçukuru Kışladağ 5 12 47 53 415 Reserve Name Company Production 2010 Tons 3 4 10 Reserves 2010 Tons 332 28 89 31 15 34 27 18 11 24 Possible Production Sites
Turkey has 700 Tons of proven reserves concentrated in Aegean and Black Sea regions
SOURCE: MTA, Istanbul Gold Exchange, McKinsey&Company
Investment Support and Promotion Agency of Turkey
Overview of Turkish Mining Industry Deep Dive on Priority Minerals of Turkish Mining Industry Phosphate Incentives
Investment Support and Promotion Agency of Turkey
13
2002 2003 2004 2005 2006 2007 2008 2009
30,8 24,6 13,8 29,4 37,3 45,7 159,9 76,2 746 610 291 496 744 782 741 707
Import(U.S $ Million) Import (Thousand Tons)
Million Tons of Phosphates reserves as
grade* of %30,5 P2O5.
process.)
export is extremely low around $15.000 a year.
rock production is extremely low around 1,000 tons per annum.
Turkish Phosphates Reserves
U.S $ Million
28 29 30 31 32 33
CAGR
Global Phosphate rock grade evaluation 1975-2010
2010 2005 2000 1995 1985 1975
Average P2O5 grade Percent
SOURCE: MTA, USGS
Investment Support and Promotion Agency of Turkey
Overview of Turkish Mining Industry Deep Dive on Priority Minerals of Turkish Mining Industry Copper Incentives
Investment Support and Promotion Agency of Turkey
15
Turkish Copper Reserves
Operational Mines Operable Mines
Downstream industries such as; Automotive(Expected to grow %11 average and reach up to 23 $ Billion in 2015) Construction(Expected to grow %7 average and reach up to 79 $ Billion in 2015) will boost Copper Imports.
2008 2009 2010 2011 2015 272 289 332 312 386 Thousand Tons +5% +5%
Copper Imports
168 126 42 332 379 5
2010,thousand metric tons
Total domestic refined Copper consumption Refined Copper import Secondary production from scrap Refined in domestic facilities Exported as concentrate Concentrate production
Primary Production Given small refining capacity most
sold as concentrate.
SOURCE: MTA,McKinsey&Company
Investment Support and Promotion Agency of Turkey
16
SX-EW Technology Opportunities
Global reserves that use SX-EW
▪
Large Turkish reserves Karakartal and Cevizlidere have a similar/more superior volume 2nd ore grade compared to major global reserves with SX-EW technology.
Karakartal Cevizlidere İkiztepe Muratdere Cerattepe 1.694 (0.30) 770 (0.38) 694 (0.29) 184 (0.36) 137 (8.8)
Large gold deposits Thousand tons
Reserves with no Production(ore grade)
SOURCE: MTA,McKinsey&Company
0.30% Karakartal Cevizlidere 0.38%
Investment Support and Promotion Agency of Turkey
Overview of Turkish Mining Industry Deep Dive on Priority Minerals of Turkish Mining Industry Aluminum Incentives
Investment Support and Promotion Agency of Turkey
18
Turkish Bauxite Reserves
In midstream Turkey has a big gap driven primarily by automotive and construction industries.
878 150 665 63
Net imports Secondary
(scrap to aluminum players)
Primary (Seydişehir)
Mid-stream production by Aluminum source 2010, thousand metric tons
Bauxite mining + alumina refining Aluminium smelting Semi production
0.025 1.0
Midstream Upstream Downstream
1.0 Net Trade 2010, U.S. $ Billion
SOURCE: MTA,McKinsey&Company
Investment Support and Promotion Agency of Turkey
Secondary production is more attractive compared to primary due to; ▪ Lower energy dependence ▪ Lower CAPEX
227 227 202 202 581 350
5% same energy required for production from scrap Other
Raw material Labor Energy Capex
Recycle Production
23 2,002 2,526 1,061 1,200 Primary production Secondary production
SOURCE: McKinsey&Company
More than half of the domestic scrap remains unused and can potentially be used in secondary production 40 80 120 160 200 240 47%
2004 2009 08 07 06 05 Total Al scrap Secondary Al
Thousand tons
Investment Support and Promotion Agency of Turkey
Overview of Turkish Mining Industry Deep Dive on Priority Minerals of Turkish Mining Industry Chromium Incentives
Investment Support and Promotion Agency of Turkey
2003 2004 2005 2006 2007 2008 2009 2010 27 61 104 120 253 498 268 475
21
Turkey has %6 of world production. Worlds 3rd chromite exporter with %12.8.
Turkish Chromium Reserves
Thousand tons U.S. $ Million
364 575 847 1.079 1.382 1.816 1.746 2.258
Thousand tons
Chromium Export
SOURCE: MTA, Team Analysis
2005 2006 2007 2008 2009 2010 2011
1.620 1.849 3.639 5.100 6.240 8.624 9.971
Investment Support and Promotion Agency of Turkey
Overview of Turkish Mining Industry Deep Dive on Priority Minerals of Turkish Mining Industry Iron and Steel Incentives
Investment Support and Promotion Agency of Turkey
23
Investment Support and Promotion Agency of Turkey
Overview of Turkish Mining Industry Deep Dive on Priority Minerals of Turkish Mining Industry Manganese Incentives
Investment Support and Promotion Agency of Turkey
25 Between 2003-2009 manganese exportation was around 170 thousand tons.
2003 2004 2005 2006 2007 2008 2009 25 21 52 32 42 51 141 Thousand tons
Manganeze Production
2003 2004 2005 2006 2007 2008 2009 288 69 259 383 427 2.530 539 Tons
Manganeze Import
Investment Support and Promotion Agency of Turkey
26
Reserve Name City Reserve(Proven+Possible) Grade(%) Explanation
Dokuz tekne Adana-Selimiye 76,5 20 25Fe+18.14. SiO2 Kontromtaşı Artvin-Ardanuç 10 38,5 6.30 Fe+1.38 SiO2 Paşalık Artvin-Ardanuç 8 21 13.0 Fe+19.0 SiO2 Balçı Artvin-Borçka 20 42,17 5.6 Fe+10 SiO2 Seçkiyat Artvin-Borçka 28,8 34,09 1.67 Fe+21.51 SiO2 Korucular Artvin-Borçka 187,5 42,8 Korucular Artvin-Borçka 202,5 22,9 Çavdarlı Artvin-Şavşat 30 31,78 8.99 Fe+10.28 SiO2 Ulukent Denizli-Tavas 4000 33,86 5.53 Fe+18.27 SiO2 Çağırgangözü Denizli-Tavas 5 57,85 Erdoğmuş Denizli-Tavas 9,2 40-45 Dilli Erzincan-Kemaliye 24 43,93 0.73 Fe+2.58 SiO2 Dostallı Gaziantep-Burç 2,5 45,3 22.30 SiO2 Karlıca Gaziantep-Burç 8,4 34,73 Zülfikar Gaziantep-Burç 30 32,62 36.29 SiO2 Y.Kalecik Gaziantep- Musabeyli 9 30-48 15.40 SiO2 K.Mustafapaşa Gaziantep- Musabeyli 145 53,65 21.50 SiO2 Suçıkan Muğla-Fethiye 5 32,9 Mendos Muğla-Fethiye 23 49,35 Çancıkorun Rize-Fındıklı 5 46,9 4.70 SiO2 Çayırdüzü Rize-Çamlıhemşin 4,5 40 Çubuklu Trabzon-Araklı 18 45 Kızırnas Trabzon-Araklı 3,6 49,23 Çağlayan Trabzon-Maçka 1,5 45,3 4 Fe Küçükyaz Trabzon-Maçka 37,5 51 3 Fe Ocaklı Trabzon-Maçka 28 35 3 Fe Kızlamba Zonguldak-Ereğli 19 35 Düzpelit Zonguldak-Ereğli 5 25
Total 4.561.75
Turkey has 4.5 Million tons of proven manganese reserves.
Thousand tons
Investment Support and Promotion Agency of Turkey
Overview of Turkish Mining Industry Deep Dive on Priority Minerals of Turkish Mining Industry Quartz Incentives
Investment Support and Promotion Agency of Turkey
28
2003 2004 2005 2006 2007 2008 2009 377 395 503 408 343 555 550
Quartz Production
Quartz Quartzite Quarts Sanstone
Thousand tons 2003 2004 2005 2006 2007 2008 2009 203 232 1.333 3.048 1.680 2.109 775 Tons
Quartz Import
Investment Support and Promotion Agency of Turkey
29 Kale Madencilik A.Ş has 800.000 tons of reserves in Çanakkale region. Sögüt Madencilik A.Ş has 2500 tons of reserves in Aydın çine region. Toprak Madencilik A.Ş has 825.000 tons of reserves. Turkey has 4-5 Million tons of quartz reserves.
2003 2004 2005 2006 2007 2008 2009 39.910 71.339 75.116 103.242 163.103 239.828 169.257
Thousand tons
Quartz Export
Investment Support and Promotion Agency of Turkey
Overview of Turkish Mining Industry Deep Dive on Priority Minerals of Turkish Mining Industry Incentives
Investment Support and Promotion Agency of Turkey
Investment Support and Promotion Agency of Turkey
NEW INCENTIVE SYSTEM
Incentives
Investments
Investments
VAT Exemption Customs Duty Exemption VAT Exemption Customs Duty Exemption Tax Reduction Employer’s Share for Insurance Premium Payment Land Provision VAT Exemption Customs Duty Exemption Tax Reduction Employer’s Share for Insurance Premium Payment Land Provision Interest Payment Support (except Region I and II) VAT Exemption Customs Duty Exemption Tax Reduction Employer’s Share for Insurance Premium Payment Land Provision Interest Payment Support VAT Refund In the 6th Region; income withholding tax and employee’s share for insurance premium payment
Investment Support and Promotion Agency of Turkey
Investment Support and Promotion Agency of Turkey
Investment Support and Promotion Agency of Turkey
35
Investment Support and Promotion Agency of Turkey
VAT Exemption
Custom Duty Exemption
Out of OIZ Investment Contribution Rate (%) Within OIZ
15 20 25 30 40 50 20 25 30 40 50 55
Payment for Out of OIZ Employer’s Share of Social Security Premium (Support Period) Within OIZ
2 years 3 years 5 years 6 years 7 years 10 years 3 years 5 years 6 years 7 years 10 years 12 years
Land Allocation
Interest Support
N/A N/A
Income Withholding Tax
N/A N/A N/A N/A N/A 10 years
Employees’ Share for Social Security Premium Payment (Support Period)
N/A N/A N/A N/A N/A 10 years
36
Investment Support and Promotion Agency of Turkey
GLOSSARY
VAT Exemption:
In accordance with the measure, VAT is not paid for imported and/or domestically provided machinery and equipment within the scope
Customs Duty Exemption:
Customs duty is not paid for the machinery and equipment provided from abroad (imported) within the scope of the investment encouragement certificate.
Tax Reduction:
Calculation of income or corporate tax with reduced rates until the total value reaches to the amount of contribution to the investment according to envisaged rate of contribution.
Social Security Premium Support (Employer's Share):
The measure stipulates that for the additional employment created by the investment, employee's share of social security premium on portions of labor wages corresponding to amount of legal minimum wage, will be covered by the Ministry. The measure is applicable
Income Tax Withholding Allowance:
The measure stipulates that the income tax regarding the additional employment generated by the investment within the scope of the investment encouragement certificate will not be liable to withholding. The measure is applicable only for the investments to be made in Region VI within the scope of an investment encouragement certificate.
Social Security Premium Support (Employee's Share):
The measure stipulates that for the additional employment created by the investment, employer's share of social security premium on portions of labor wages corresponding to amount of legal minimum wage, will be covered by the Ministry.
Interest Payment Support:
Interest payment support, is a financial support instrument, provided for the loans with a term of at least one year obtained within the frame of the investment encouragement certificate. The measure stipulates that a certain portion of the interest /profit share regarding the loan equivalent of at most 70% of the fixed investment amount registered in the certificate will be covered by the Ministry.
Land Allocation:
Refers to allocation of land to the investments with Investment Incentive Certificates in accordance with the rules and principles determined by the Ministry of Finance.
VAT Refund:
VAT collected on the building & construction expenses made within the frame of strategic investments with a fixed investment amount
Investment Support and Promotion Agency of Turkey
INVESTMENT CONTRIBUTION RATE (%) TAX DEDUCTION
INVESTMENT CONTRIBUTION TO BE APPLIED DURING INVESTMENT / OPERATIONAL PERIOD (%) INVESTMENT PERIOD OPERATIONAL PERIOD
38
Investment Support and Promotion Agency of Turkey
MINIMUM WAGE AND DEDUCTIONS (01.01.2012-30.06.2012) Components of Labor Cost (Legal Minimum Wage) Deductible Amounts with Support Measures Gross Wage 886,50 TL
124,11 TL
Premium 8,87 TL
113,03 TL
5,85 TL
251,86 TL
634,64 TL
Employer’s Share in Social Security Premium (% 19.5) 172,87 TL 172,87 TL Employer’s Share of Unemployment Insurance Premium (% 2) 17,73 TL LABOR COST TO EMPLOYER 1.077 TL 172,87 TL
Investment Support and Promotion Agency of Turkey
REGION II REGION III REGION IV REGION V REGION VI Investment Amount (‘000 TL) 5.000 5.000 5.000 5.000 5.000 Tax Deduction (%) 55 60 70 80 90 Investment Contribution Rate (%) 20 25 30 40 50 Deductible Tax Amount (‘000 TL) 1.000 1.250 1.500 2.000 2.500 During Investment Period (‘000 TL) (10%) 100 (20%) 250 (30%) 450 (50%) 1.000 (80%) 2.000 During Operational Period (‘000 TL) (90%) 900 (80%) 1.000 (70%) 1.050 (50%) 1.000 (20%) 500 Corporate tax rate to be applied until investment contribution is realized (%) 9
(tax rate to be deducted 11%)
8
(tax rate to be deducted: 12%)
6
(tax rate to be deducted 14%)
4
(tax rate to be deducted: 16%)
2
(tax rate to be deducted: 18%)
40
Investment Support and Promotion Agency of Turkey
FOR LOANS IN TL FOR LOANS IN FOREIGN CURRENCY
41
Investment Support and Promotion Agency of Turkey
42
Investment Support and Promotion Agency of Turkey
43