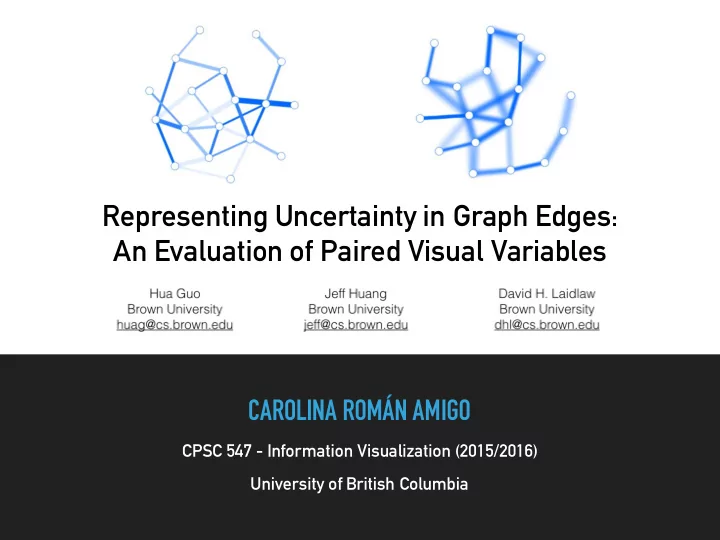

Representing Uncertainty in Graph Edges: An Evaluation of Paired Visual Variables CAROLINA ROMÁN AMIGO CPSC 547 - Information Visualization (2015/2016) University of British Columbia
2 +
3 CONCEPT OF INTEGRALITY (GARNER, 2014) SEPARABLE INTEGRAL interference
4 RESEARCH QUESTIONS ▸ 1) is the effectiveness of a visual variable in encoding uncertainty in a graph strongly influenced by the presence of other visual variables? ▸ 2) is the influence of the additional visual variables strong enough to alter the effectiveness ranking for a set of visual variables? ▸ 3) how do other factors in the visualization affect the degree of interference between a pair of visual variables?
5 EVALUATION PROCESS 1. Determine factors and variables 2. Determine hypotheses 3. Design of Stimuli 4. Pilot for determining parameters 5. Run trials 6. Analyze results 7. Develop conclusions
6 DETERMINE FACTORS AND VARIABLES PILOT FOR PARAMETERS FACTOR vCERTAINTY
7 DETERMINE FACTORS AND VARIABLES PILOT FOR PARAMETERS FACTOR vSTRENGTH
8 DETERMINE FACTORS AND VARIABLES PILOT FOR PARAMETERS FACTOR DISCRIMINABILITY
9 DESIGN OF STIMULI DESIGN OF STIMULI - PAIR EXAMPLES Lightness and width Fuzziness and width Fuzziness and saturation Lightness and saturation
10 DETERMINE FACTORS AND VARIABLES PILOT FOR PARAMETERS FACTOR TASK TYPE Find if an edge of given value is present Which one has higher strength/certainty (5 seconds) (3 seconds)
11 RUN TRIALS TRIAL ORDERING
12 ANALYZE RESULTS RESULTS ANALYSIS METHOD ▸ RM-ANOVA in SPSS, statistic significance
13 DETERMINE HYPOTHESIS ANALYZE RESULTS HYPOTHESES 1 AND 2 PARTIALLY VALID ▸ There will be an interaction effect between vCertainty and vStrength when certainty is the primary attribute. The effectiveness of fuzziness, grain, and transparency will not change significantly with different vStrengths. Lightness will be more accurate when paired with width than with hue or saturation. ▸ Lightness was less accurate when paired with hue than with width or saturation.
14 DETERMINE HYPOTHESIS ANALYZE RESULTS HYPOTHESES 3 AND 4 PARTIALLY VALID ▸ There will be an interaction effect between vCertainty and vStrength when strength is the primary attribute. The accuracy of width will not vary significantly with different vCertainties. Hue and saturation will have much lower accuracy when certainty is encoded using lightness compared to other alternatives. ▸ Fuzziness turned out to have a stronger negative impact on the perception of width than the other three certainty visual variables.
15 DETERMINE HYPOTHESIS ANALYZE RESULTS HYPOTHESIS 6 REJECTED ▸ Accuracy will be the same on the visual search tasks as on the comparison tasks. ▸ Participants were generally more accurate on the comparison tasks than on the visual search tasks.
16 DETERMINE HYPOTHESIS ANALYZE RESULTS HYPOTHESIS 8 REJECTED ▸ There are no significant interaction effects between task type and vStrength or between task type and vCertainty. ▸ Visual search task: participants were most accurate with width and were significantly more accurate at interpreting width than saturation. ▸ Comparison task: participants were least accurate with width and were significantly less accurate at interpreting width than hue.
17 DETERMINE HYPOTHESIS ANALYZE RESULTS HYPOTHESES 5 AND 7 REJECTED ▸ Accuracy will be lower under the low-discriminability condition than the high-discriminability condition. There will be no significant interaction effects between difficulty and vStrength in edge certainty tasks or between difficulty and vCertainty in edge strength tasks. TARGET TYPE STRENGTH Lower discriminability meant higher accuracy to the vStrength = width and vCertainty = fuzziness.
18 DEVELOP CONCLUSIONS CONCLUSIONS AND RECOMMENDATIONS ▸ Lightness is an effective visual variable for depicting uncertainty; but lightness should not be combined with hue. ▸ Fuzziness, grain, and transparency are all robust to encode the secondary dimension. However, fuzziness has a strong negative impact on the perception of width. ▸ Consider user tasks at the earlier stage of choosing visual variables. ▸ Perception of one of the variables of a pair can be made easier either by increasing its discriminability or by reducing the discriminability of the other visual variable.
19 CRITIQUE ▸ They don’t justify the graph size chosen (18 nodes and 25 edges). Too small and simple, and graph size matters to readability. How applicable are these results to larger graphs? ▸ Wrong use of the term piloting for discriminability definition? ▸ Background colour for tasks screens examples is light orange in the paper. I guess they didn’t use it like that on the experiment, so it is confusing.
Guo, H., Huang, J., & Laidlaw, D. H. (2015). Representing Uncertainty in Graph Edges : An Evaluation of Paired Visual Variables. IEEE Transactions on Visualization and Computer Graphics, 21(10), 1173– 1186. Carolina Román Amigo THANK YOU carolamigo@gmail.com
Recommend
More recommend