
SLIDE 1
Colorado State GHG Footprint
FY11
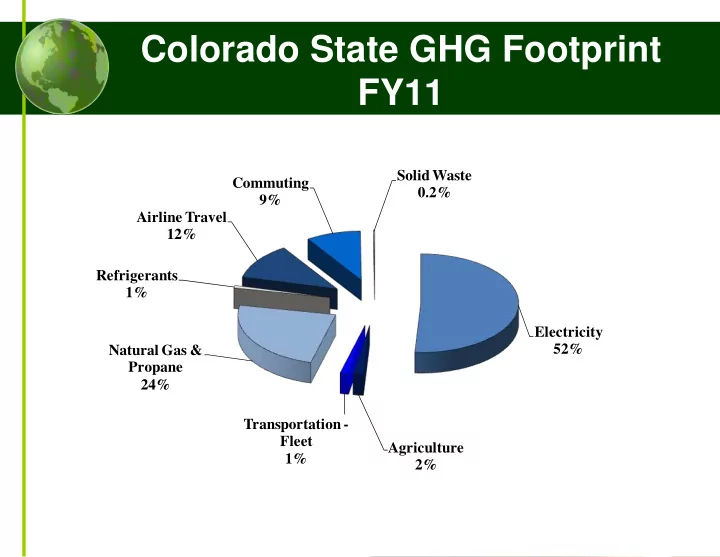
Electricity 52% Agriculture 2% Transportation - Fleet 1% Natural Gas & Propane 24% Refrigerants 1% Airline Travel 12% Commuting 9% Solid Waste 0.2%
{ Renewable energy Forest carbon sequestration 100,000 State - - PowerPoint PPT Presentation
Colorado State GHG Footprint FY11 Solid Waste Commuting 0.2% 9% Airline Travel 12% Refrigerants 1% Electricity 52% Natural Gas & Propane 24% Transportation - Fleet Agriculture 1% 2% 300,000 Climate Action Plan Summary
Electricity 52% Agriculture 2% Transportation - Fleet 1% Natural Gas & Propane 24% Refrigerants 1% Airline Travel 12% Commuting 9% Solid Waste 0.2%
Business-As-Usual Forecast for CSU Building energy efficiency Renewable energy
50,000 100,000 150,000 200,000 250,000 300,000 FY06 FY10 FY14 FY18 FY22 FY26 FY30 FY34 FY38 FY42 FY46 FY50
Metric Tons Carbon Dioxide Equivalent (MTCO2e)
Energy conservation Forest carbon sequestration State policies Transportation Solid waste diversion
Remaining emissions