reminder next week you have
play

Reminder: Next week you have 1 Monday Tuesday Wednesday - PDF document

P1 SepOct 2012 Timothy Van Zandt Prices & Markets Page 1 Session 8 Pricing with Market Power Reminder: Next week you have 1 Monday Tuesday Wednesday Thursday Friday Session 9 Review Quiz Session 10 Roxy case


  1. P1 Sep–Oct 2012 • Timothy Van Zandt • Prices & Markets Page 1 Session 8 • Pricing with Market Power Reminder: Next week you have … 1 Monday Tuesday Wednesday Thursday Friday Session 9 Review Quiz – Session 10 Roxy case 
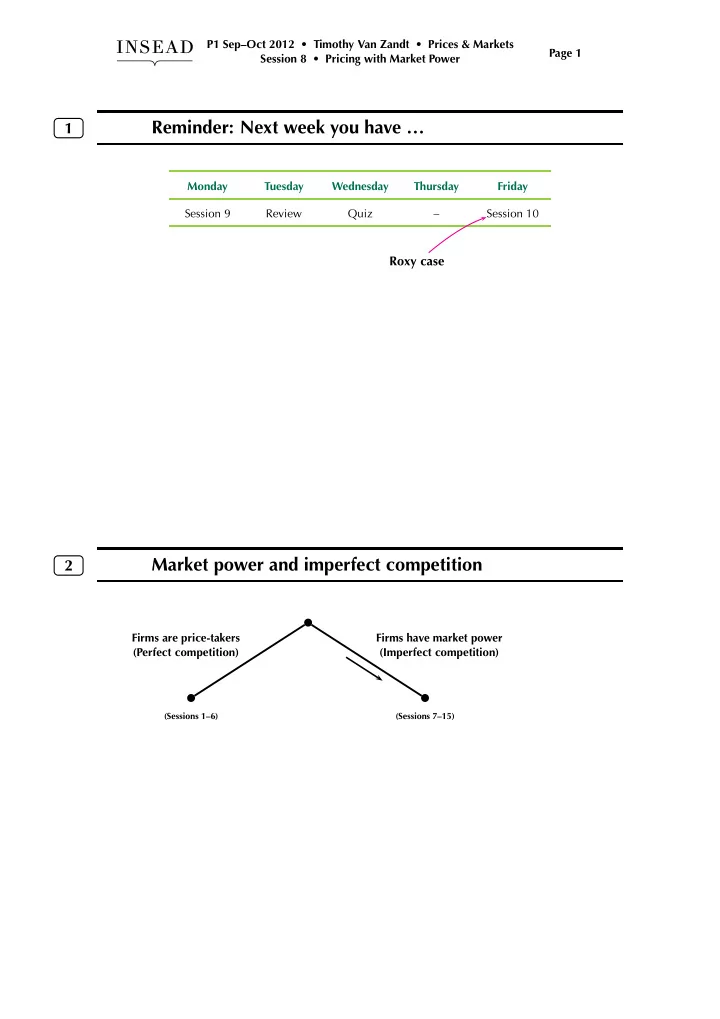
Market power and imperfect competition 2 Firms are price-takers Firms have market power (Perfect competition) (Imperfect competition) (Sessions 1–6) (Sessions 7–15)

  2. P1 Sep–Oct 2012 • Timothy Van Zandt • Prices & Markets Page 2 Session 8 • Pricing with Market Power Pricing with market power 3 Firms are price-takers Firms have market power (Perfect competition) (Imperfect competition) (Sessions 1–6) Individual Equilibrium decisions (Sessions 7–11) (Sessions 12–15) From the individual firm’s viewpoint 4 P i “Demand curve” for i ’s output 5 Price taker: 4 No trade-off P 3 2 1 Q i 1 2 3 4 5 6 7 P i Demand curve for i ’s output Market power: 5 volume–price 4 trade-off 3 2 1 Q i 1 2 3 4 5 6 7

  3. P1 Sep–Oct 2012 • Timothy Van Zandt • Prices & Markets Page 3 Session 8 • Pricing with Market Power Where are the other firms? 5 P i “Demand curve” for i ’s output Price taker: 5 perfect 4 competition P 3 2 1 Q i 1 2 3 4 5 6 7 P i Demand curve for i ’s output Market power: 5 imperfect 4 competition 3 2 1 Q i 1 2 3 4 5 6 7 Quantity choice? It’s about MR vs MC 6 P 5 Price taker: 4 3 Demand 2 1 Q 1 2 3 4 5 6 7 P 5 Market power: 4 3 2 1 Demand Q 1 2 3 4 5 6 7

  4. P1 Sep–Oct 2012 • Timothy Van Zandt • Prices & Markets Page 4 Session 8 • Pricing with Market Power Marginal revenue versus price 7 (Data are from Exercise 7.3) What is your marginal revenue for unit 8? € 57 (1000s) 54 Demand 51 48 45 42 39 36 33 30 27 24 21 18 15 12 9 6 3 1 2 3 4 5 6 7 8 9 10 11 12 13 Q Marginal revenue for linear demand 8 Demand: Q = 16 − (2 / 3) P d ( P ) Inverse demand: p ( Q ) Revenue: r ( Q ) = p ( Q ) × Q Marginal revenue: MR = r ′ ( Q )

  5. P1 Sep–Oct 2012 • Timothy Van Zandt • Prices & Markets Page 5 Session 8 • Pricing with Market Power Graph of the demand and MR curves for linear demand 9 € d ( Q ) = 16 − (2 / 3) P 24 p ( Q ) = 24 − (3 / 2) Q 22 20 mr ( Q ) = 24 − 3 Q p ( Q ) 18 16 14 12 10 8 6 4 2 2 4 6 8 10 12 14 16 − 2 Q − 4 − 6 Linear demand and constant MC 10 € 24 22 20 p ( Q ) 18 16 14 12 10 8 mc ( Q ) 6 4 2 2 4 6 8 10 12 14 16 − 2 Q − 4 mr ( Q ) − 6

  6. P1 Sep–Oct 2012 • Timothy Van Zandt • Prices & Markets Page 6 Session 8 • Pricing with Market Power The markup over MC 11 $ 25 20 15 MC 10 d ( P ) 5 20 40 60 80 100 120 140 160 Q MR Markup is the gap between P and MR 12 € 57 (1000s) 54 Demand 51 48 45 42 39 36 33 30 27 24 21 18 15 12 9 6 3 1 2 3 4 5 6 7 8 9 10 11 12 13 Q

  7. P1 Sep–Oct 2012 • Timothy Van Zandt • Prices & Markets Page 7 Session 8 • Pricing with Market Power Session 8: Pricing with Market Power 13 1. The quantity choice. ✓ ➥ 2. Entry and exit. 3. Business-plan example (P&M meets FMV & UDJ & Man. Acc.) Exit/Entry: Effect of a LR fixed cost 14 FC affects shut-down option, not whether you produce 10 or 12 units (or whether you charge 20 or 24). Recipe: 1 Calculate profit-maximizing price/quantity ignoring the fixed cost. 2 Calculate profit ignoring the fixed cost (“variable profit”). 3 Check whether it is higher than the fixed cost. If so, go ahead and produce; otherwise shut down or don’t start up. Patent protection Cash flow Patent expires, Product competition with generics launch 0 Time Entry of similar R&D Testing patented molecules & approval

  8. P1 Sep–Oct 2012 • Timothy Van Zandt • Prices & Markets Page 8 Session 8 • Pricing with Market Power Graphically 15 € Consumer surplus ¯ P 30 25 P e Deadweight loss 20 Variable profit Marginal cost 15 mc ( Q ) MC 10 Inverse demand Variable cost 5 p ( Q ) 1 2 3 4 5 6 7 8 Q π Q (millions) Socially efficient benchmark 16 € ¯ P 30 Marginal valuation mv ( Q ) (i.e., inverse demand p ( Q ) ) 25 20 Gains from trade (variable surplus) Marginal cost 15 mc ( Q ) MC 10 Variable cost 5 1 2 3 4 5 6 7 8 Q e Q (millions)

  9. P1 Sep–Oct 2012 • Timothy Van Zandt • Prices & Markets Page 9 Session 8 • Pricing with Market Power Session 8: Pricing with Market Power 17 1. The quantity choice. ✓ ✓ 2. Entry and exit. ➥ 3. Business-plan example (P&M meets FMV & UDJ & Man. Acc.) Monday: How pricing depends on demand 18 Finally see elasticity in action! …and we get some nice qualitative (low data) conclusions: 1. Volume effect: higher volume ⇒ higher price. 2. Price-sensitivity effect: less elastic ⇒ higher price. FPM reading. Chapter 9. Article. “Airlines Hold Back”. Deliverables. Exercise 9.3. (The demand exercise that I sent by email—also on course website under “Extras”— is good preparation.)

Download Presentation
Download Policy: The content available on the website is offered to you 'AS IS' for your personal information and use only. It cannot be commercialized, licensed, or distributed on other websites without prior consent from the author. To download a presentation, simply click this link. If you encounter any difficulties during the download process, it's possible that the publisher has removed the file from their server.

Recommend


More recommend