
SLIDE 1
Reformulation Project The Evolution of Food and Drink in Ireland - - PowerPoint PPT Presentation
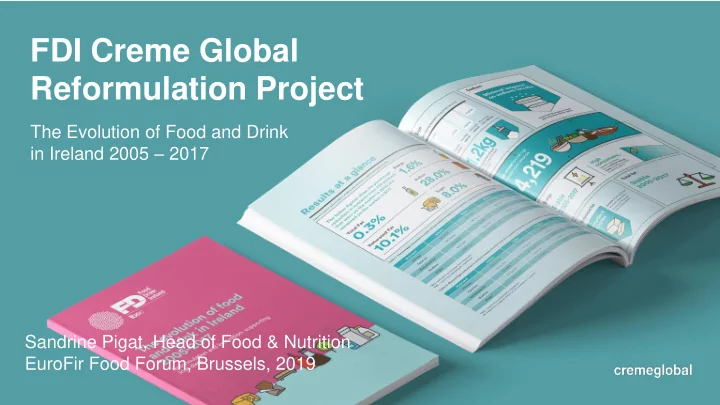
FDI Creme Global Reformulation Project The Evolution of Food and Drink in Ireland 2005 2017 Sandrine Pigat, Head of Food & Nutrition EuroFir Food Forum, Brussels, 2019 About Creme Global Creme Global is a Scientific Data Modelling
Creme Global is a Scientific Data Modelling & Technology Company. Creme Global uses data science to understand food intakes, nutrition and health in consumer populations to inform food formulation and public health strategies.
Estimate the impact of reformulation and the introduction of new products on the nutrient intakes of the Irish population. Surveys Used:
The National Teens’ Food Survey (2005 – 2006) National Children’s Food Survey (2003 – 2004) National Adult Nutrition Survey (2008 – 2010) National Pre-school Nutrition Survey (2010 – 2011)
Nutrients:
Sodium Fat Saturated Fat Sugar Energy
Project Scope Retail
Directly replaced survey foods – no scope for product choice changing between years.
Consumer Basket 2005 2017
popular in 2005 to products popular in 2017.
the market.
❑ Beverages excluding milk ❑ Desserts, biscuits, cakes, ice-cream and confectionery ❑ Meat products ❑ Milk and dairy products ❑ Breakfast cereals ❑ Rice, pasta, savouries and gluten free bread ❑ Savoury snacks including crisps ❑ Soups, sauces, pulses and misc. foods ❑ Spreading fats
Participating companies
gfat /100g gfat /100g gfat /100g Product 1 Product 2 Product 3
gfat /100g gfat /100g gfat /100g Product 1 Product 2 Product 3
Product 4 gfat /100g NEW
New product enters the market
Frequency Amount Nutrient Concentration
40g
Diary Day 1
500g 200g 90g 0.6% 0.02% 1.5% 0.007%
Daily Average Daily Average Daily Average
Daily Average Daily Average Daily Average
Mean Consumer Intake
95th Percentile Consumer Intake (High Consumer) Mean Consumer Intake
2005 2017 2005 2017
Rest of the market Rest of the market
Change in Mean Consumer Intake
Change in P95 Consumer Intake
Direct reformulation of products on the market in both 2005 and 2017
These figures show the percentage reduction in nutrients from 235 products that were on the market in 2005 and remained on the market in 2017.
Intakes
Sandrine Pigat Sandrine.pigat@cremeglobal.com www.cremeglobal.com