
SLIDE 1
Recognition of Capillary Seals in Hydrocarbon Accumulations Using SP Logs
Stephen P. Cumella, William F. Woodruff, and Andre Revil
Recognition of Capillary Seals in Hydrocarbon Accumulations Using SP - - PowerPoint PPT Presentation
Recognition of Capillary Seals in Hydrocarbon Accumulations Using SP Logs Stephen P. Cumella, William F. Woodruff, and Andre Revil Characteristics of SP Anomalies MVRD Discussed in This Talk SP anomalies are absent in the first wells
Recognition of Capillary Seals in Hydrocarbon Accumulations Using SP Logs
Stephen P. Cumella, William F. Woodruff, and Andre Revil
Characteristics of SP Anomalies Discussed in This Talk
wells drilled in a new area of a basin.
produced, SP anomalies begin to appear and tend to increase in magnitude as more wells are drilled.
carbonaceous shales, etc.
areas of Mamm Creek field that have been completed with large water- volume hydraulic fracs compared with adjacent areas completed with smaller fracs. Completion intervals shown in pink
Rollins
Price Coal MVRD
AAPG Bull., 2017
Membrane potential Liquid-junction potential
SP Electrochemical Potential
Schlumberger, 1991
Figure 1a sketches a clay mineral with different crystalline planes. All these planes contain a density of electrical charges when in contact with water due to a variety of charging mechanisms. This charge is locally counterbalanced by a charge of opposite sign in the so-called electrical double layer. As a result of this electrical double layer there is a net (generally positive) amount of electrical charge in the pore water. Under a pore-fluid pressure gradient, the pore water flows from high pressures to low pressures through the interconnected pore space (Figure 1b). This flow drags the excess of charges contained in the pore water (Figure 1c) generating an electrical current density called the streaming current that is negative in an upstream direction and positive in a downstream direction.
Cumella, Woodruff, and Revil, AAPG Bull, 2017
Electrokinetic Potential Results from Water Movement through a Formation
MOC #27-07 Jonah Federal From Dean Dubois
Piceance Basin, Mamm Creek Field SP Anomaly Caused by Streaming Potential
undepleted sands have minor SP deflection, high neutron-density crossover
depleted sand has big SP anomaly due to streaming potential, no crossover due to invasion past depth of investigation of neutron and density curves 392 ft
Borehole Pressure Greater Than Formation Pressure Negative “Normal” SP Response Formation Pressure Greater Than Borehole Pressure Positive “Reverse” SP Response
Electrokinetic SP Response Resulting from Differences in Borehole Vs Formation Pressure
+
Overpressured formation water flows into borehole
SP Log SP Log Serra (1984) p.78
Bartberger and Pasternack, 2015
Bartberger and Pasternack, 2015
Cumella, Woodruff, and Revil, AAPG Bull, 2017
Cumella, Woodruff, and Revil, AAPG Bull, 2017
Cumella, Woodruff, and Revil, AAPG Bull, 2017
Cumella, Woodruff, and Revil, AAPG Bull, 2017
Cumella, Woodruff, and Revil, AAPG Bull, 2017
Piceance Basin, Mamm Creek Field SP Cross Section with Pressure Data
greater Map view diagram illustrating the mechanism for the negative SP anomalies in the Piceance
the electrical field that results from production-driven water migration in the formation; b). Infill gas wells shown in red, drilled in areas of negative electrical potential. In the Mesaverde we observe a classical SP response in early (gray) wells with negative anomalies developing
electrochemical potential in which the upstream areas become negative and the downstream areas (producing wells) become positive.
Cumella, Woodruff, and Revil, AAPG Bull, 2017
Key Points from Papers by Cathles and Others
pressure compartmentalization caused by capillary seals that form when two fluid phases exist in interlayed fine and coarse sediments.
even in geologic time.
stronger capillary seals than oil.
small, since only the areas immediately adjacent to fine-coarse interfaces need contain a non-aqueous fluid (Price Coal example).
sedimentary rocks is dramatic; for a constant heat flow, the thermal gradient can easily be doubled.
very long times, perhaps explaining the phenomena of basin-centered gas.
From Shosa and Cathles, 2001
In this experiment, a 0.5 meter tube contains five sediment packages consisting of an 11 mm layer of 45-micron coarse silt, a 13-15 mm layer of 2-micron very fine silt, and an 11 mm layer of 45-micron coarse silt. The remaining volume of the tube was filled with 0.5 mm coarse sand. Water with dissolved CO2 was driven through the tube at various flow rates; the pressure drop across the tube was measured at each rate. The system pressure was lowered below the partial pressure of CO2 for this solution and a separate CO2 gas phase formed and the capillary force between the gas and the liquid stopped the
blockage by individual fine layers is thus cumulative. The best estimate of the capillary pressure drops per 2-micron layer is 34.1 psi.
Shosa and Cathles 2001
From Revil and others, 1998 Abnormal Pressure at Shallow Depths in an ODP Borehole in the Mediterranean Sea Caused by Capillary Sealing
Model for SP response due to electrokinetic potential resulting from water flow within pressure compartments formed by capillary seals
The first well drilled in an area with no previous Mesaverde production has little SP response and the SP log drifts to more positive values with depth (e.g., the well on the left). After Mesaverde production is established, producing wells produce water in addition to gas. The water movement creates an electrical current resulting from the movement of positive charges in the direction of water flow. Water movement will always be away from unproduced areas and these areas will develop a more negative charge with continued water production in adjacent
within pressure compartments that are isolated by capillary seals formed adjacent to coals. This cross section depicts higher volumes of water flow within some compartments resulting in more negative SP response in a recently drilled well (the well on the right). The blue arrows indicate water flow and the length of the arrow is indicating the volume of water flow within each compartment (longer arrow=higher volume
Cumella, Woodruff, and Revil, AAPG Bull, 2017
Cumella, Woodruff, and Revil, AAPG Bull, 2017
Cumella, Woodruff, and Revil, AAPG Bull, 2017
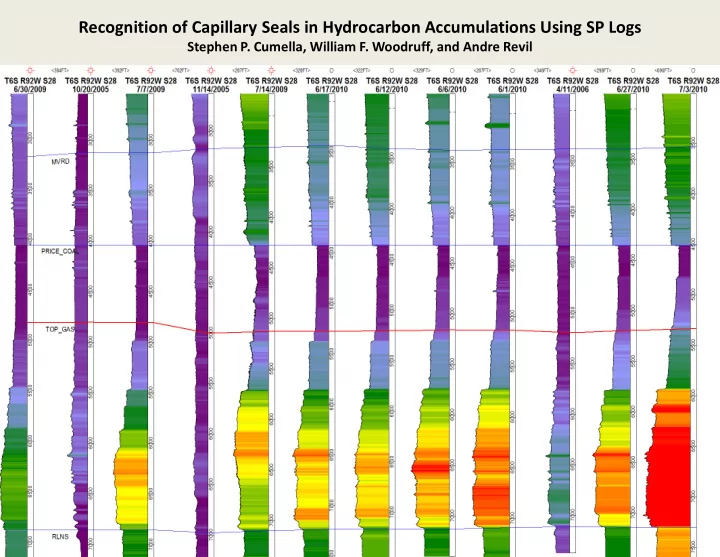
Increase in SP Anomaly with Time, Wells in Section 20, 6S-92W, Mamm Creek Field
SP Colorfill Scale
Rollins Price Coal Top Gas MVRD
Gamma ray in track 1, SP in track 2.
Rollins Price Coal Top Gas MVRD
Gamma ray in track 1, SP in track 2. SP Colorfill Scale
Piceance North Parachute-Red Point Area
MVRD Price Coal Rollins
San Juan Basin Pictured Cliffs-Fruitland SP Cross Section
Pictured Cliffs Lewis Shale Fruitland Coal
Pictured Cliffs
Anadarko Basin Granite Wash SP Cross Section
Desmoines
Cross section by Ben Funderburk, Forest
Capillary Seal?
Pressure-depth plots for five 30-mile x 30-mile areas, dotted lines show gradients ranging from hydrostatic to lithostatic. Pressure data are taken from a) Al-Shaieb and others (1994), green symbols; b) mud weights from IHS Energy (2010), red symbols; c) bottom-hole pressures from IHS Energy (2010), blue symbols; and d) drillstem tests from IHS Energy (2010), brown symbols. Area A is underpressured as shown by separation between hydrostatic gradient and right edge of drillstem pressures. Area B is underpressured, but less than area
small fraction of drillstem pressures are valid in situ pore pressures, most are less than the true insitu pore pressure. (Nelson, USGS OFR 2011-1245).
Uinta Basin, Natural Buttes Field SP Cross Section
TGR3 Wasatch
Mesaverde Castlegate
Uinta Basin, Natural Buttes Field SP Cross Section SP Anomaly Occurs near Coal
Uinta Basin, Brundage Canyon Field SP Cross Section Cross section by Dan Berberick, Ute Energy
DJ Basin Niobrara SP Cross Section
A B C
Codell
Ft Hays
DJ Basin Niobrara SP Cross Section
are common in later wells.
to hydrocarbon sources such as coals and organic-rich shales.
formed by capillary seals.
accumulations.
distribution observed in overpressured accumulations such as the Piceance Basin.
capillary seals.
but the SP anomalies are very really and are probably very significant.
few minutes and a large number of digital SP logs can determine if they exist.