
SLIDE 1
1
Recent Developments in the NAFTA Steel Industry
NAFTA Industry Presentation to OECD Steel Committee Paris, France May 11, 2015
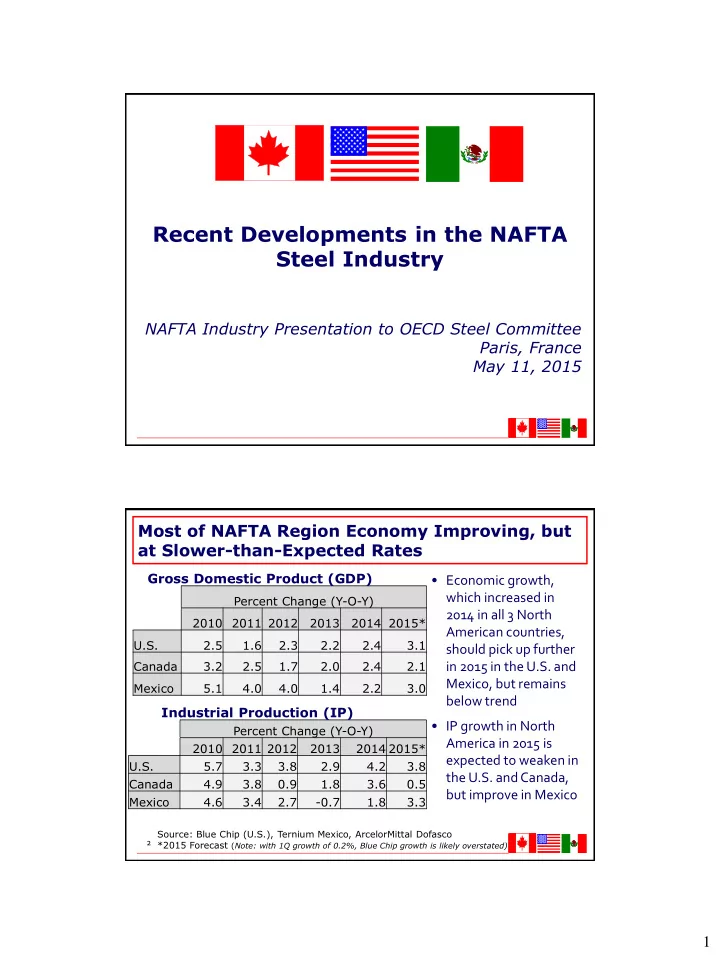
Gross Domestic Product (GDP)
Percent Change (Y-O-Y) 2010 2011 2012 2013 2014 2015* U.S. 2.5 1.6 2.3 2.2 2.4 3.1 Canada 3.2 2.5 1.7 2.0 2.4 2.1 Mexico 5.1 4.0 4.0 1.4 2.2 3.0
Industrial Production (IP)
Percent Change (Y-O-Y) 2010 2011 2012 2013 2014 2015* U.S. 5.7 3.3 3.8 2.9 4.2 3.8 Canada 4.9 3.8 0.9 1.8 3.6 0.5 Mexico 4.6 3.4 2.7
- 0.7
1.8 3.3
Source: Blue Chip (U.S.), Ternium Mexico, ArcelorMittal Dofasco *2015 Forecast (Note: with 1Q growth of 0.2%, Blue Chip growth is likely overstated)
- Economic growth,
which increased in 2014 in all 3 North American countries, should pick up further in 2015 in the U.S. and Mexico, but remains below trend
- IP growth in North
America in 2015 is expected to weaken in the U.S. and Canada, but improve in Mexico
2