
SLIDE 1
Recall 1
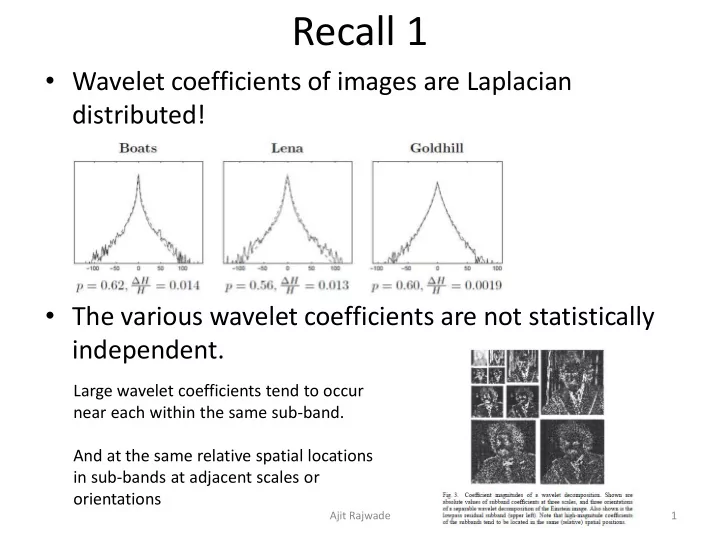
- Wavelet coefficients of images are Laplacian
distributed!
- The various wavelet coefficients are not statistically
independent.
Ajit Rajwade 1
Large wavelet coefficients tend to occur near each within the same sub-band. And at the same relative spatial locations in sub-bands at adjacent scales or
- rientations