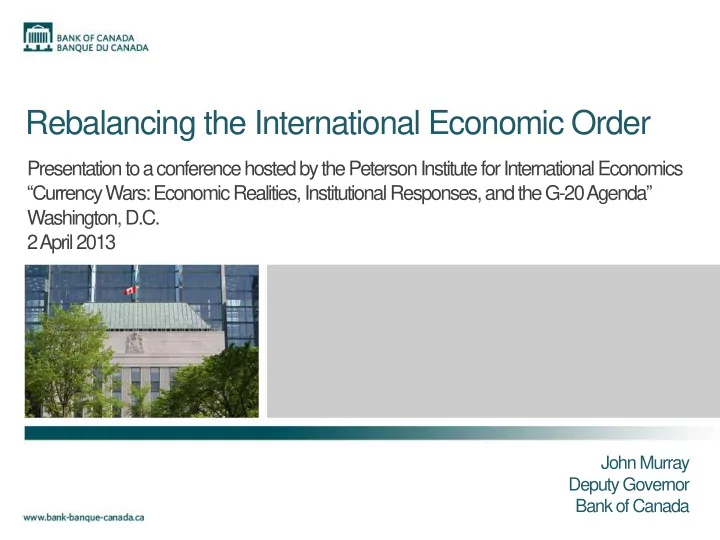

Rebalancing the International Economic Order Presentation to a conference hosted by the Peterson Institute for International Economics “Currency Wars: Economic Realities, Institutional Responses, and the G-20 Agenda ” Washington, D.C. 2 April 2013 John Murray Deputy Governor Bank of Canada
Escaping the “prisoner’s dilemma” Urgent need to rotate global demand Deleveraging required in advanced economies and greater reliance on external demand Less reliance on export-led growth required in emerging market economies and increased reliance on domestic demand Fundamental asymmetries in the existing system and the need for co-operative strategies (the G-20 Framework) 2
Estimating the benefits of co-operation and the costs of failure Three illustrative scenarios drawn from model-based simulations: 1. The good solution 2. The bad solution 3. The ugly solution 3
Key elements of the good solution The good solution involves four key elements: 1. Fiscal consolidation in most AEs 2. Household and bank deleveraging in many AEs 3. Structural reforms to promote growth in some AEs 4. Structural reforms and exchange rate adjustment in many EMEs ( Charts 1, 2 ) 4
Heavy costs of delaying needed adjustment The bad solution occurs when essential policies are delayed: ( Chart 3 ) 1. Loss of US $6 trillion by 2015, equivalent to 8 per cent of global GDP ( Chart 4 ) 2. Cumulative loss in global output of US $16 trillion in net present value (NPV) over the 2012-16 period 5
Doing half the job could be even worse The ugly solution occurs if adjustment is asymmetric: 1. Much larger losses over the near term if AEs front-load fiscal consolidation without demand rotation ( Chart 5 ) 2. NPV cumulative losses over the next five years equivalent to $17.6 trillion, 10 per cent higher than the “bad” solution Exchange rate adjustment is an important part of the solution 6
Smaller, open economies caught in the middle Canada is a small open economy that plays by the rules ( Chart 6 ) Pressures from those who break the rules are displaced onto more flexible currencies Effects of persistent large-scale intervention and capital controls differ substantively from those of quantitative easing They target exchange rates directly and lead to zero-sum outcomes 7
Charts 8
Chart 1: The “good” solution: adjustment in exchange rates Real effective exchange rates in China and the United States Index: 2011Q3 = 1 Index 1.3 1.2 Data Projection 1.1 1.0 0.9 0.8 2004 2006 2008 2010 2012 2014 2016 2018 2020 China: Good Solution US: Good Solution Last observation: June 2011 Sources: GMUSE and BoC-GEM-Fin simulations 9
Chart 2 - The “good” solution: global imbalances resolved Current account balances % of GDP 12 9 Data Projection 6 3 0 -3 -6 -9 2004 2006 2008 2010 2012 2014 2016 2018 2020 United States China Japan Euro area Sources: GMUSE & BoC-GEM-Fin simulations Last observation: June 2011 10
Chart 3 - The “bad” solution: adjustments are delayed The “bad” solution – Chinese real effective exchange rate Index: 2011Q3 = 1 Index 1.30 1.20 Data Projection 1.10 1.00 0.90 0.80 2004 2006 2008 2010 2012 2014 2016 2018 2020 Good solution Bad solution Sources: GMUSE and BoC-GEM-Fin simulations Last observation: June 2011 11
Chart 4 - The “bad” solution: 6 trillion USD loss in global GDP by 2015 The “bad” solution— GDP relative to the baseline scenario Index: 2011Q3 = 1 Index 1.05 1.00 Projection Data 0.95 0.90 0.85 2010 2011 2012 2013 2014 2015 World China United States Last observation: June 2011 Sources: GMUSE and BoC-GEM-fin simulations 12
Chart 5 - Doing half the job could be even worse... The “bad” and the “ugly” scenarios – GDP relative to the good scenario Index Index: 2011Q3 = 1 1.02 1.00 0.98 0.96 Data Projection 0.94 0.92 0.90 2010 2011 2012 2013 2014 2015 Bad solution Ugly solution Last observation: June 2011 Sources: GMUSE and BoC-GEM-Fin simulations 13
Chart 6 - Adjustment has been displaced Real effective exchange rates Index: 2002 Q1 = 100, quarterly data Index 180 160 140 120 100 80 60 2002 2003 2004 2005 2006 2007 2008 2009 2010 2011 2012 Brazil China Canada Last observation: 2012Q4 Source: Bank for International Settlements 14
Quotes 15
What are the rules of the game? Article IV, Section I, paragraph iii of the IMF’s Articles of Agreement states that members shall: “avoid manipulating exchange rates or the [international monetary system] in order to prevent effective balance of payments adjustments or to gain unfair competitive advantage over the members.” 16
What are the rules of the game? (cont’d) 2007 Decision on Bilateral Surveillance over Members’ Policies broadened members’ obligations (paragraph14): “ C. Members should take into account in their intervention policies the interests of other members, including those of the countries in whose currencies they intervene. D. A member should avoid exchange rate policies that result in external instability.” 17
References 18
References Carney, M. 2011.“Growth in the Age of Deleveraging.” Speech to the Empire Club of Canada/Canadian Club of T oronto, T oronto, Ontario, 12 December. de Resende, C., C. Godbout, R. Lalonde, É. Morin and N. Perevalov. 2012. “On the Adjustment of the Global Economy.” Bank of Canada Review , (spring) 1-15. Lavigne, R. and S. Sarker. 2012 “The G -20 framework for strong, sustainable and balanced growth: Macroeconomic coordination since the crisis,” Bank of Canada Review , (winter) 2012-2013. Murray, J. 2011. “With a Little Help from Your Friends: The Virtues of Global Economic Coordination.” Speech to the State University of New York at Plattsburgh, Plattsburgh, New York, 29 November. Murray, J. 2012 . “The Great Frustration: Hesitant Steps T oward Global Growth and Rebalancing.” Speech to the New York Association for Business Economics, New York, New York, 27 November. 19
Recommend
More recommend