reactor flow and structure vibration models
play

Reactor Flow and Structure Vibration Models Tae-Soon Kwon Korea - PDF document

Transactions of the Korean Nuclear Society Virtual Spring Meeting July 9-10, 2020 Reactor Flow and Structure Vibration Models Tae-Soon Kwon Korea Atomic Energy Research Institute, Daedeok-daero 1045, Yuseong, Daejeon, 34057, Korea Corresponding


  1. Transactions of the Korean Nuclear Society Virtual Spring Meeting July 9-10, 2020 Reactor Flow and Structure Vibration Models Tae-Soon Kwon Korea Atomic Energy Research Institute, Daedeok-daero 1045, Yuseong, Daejeon, 34057, Korea Corresponding author: tskwon@kaeri.re.kr 1. Introduction The test facility in which a 1/5 scale model to 𝑣 𝑝𝑆 = √𝑀 𝑆 simulate the advanced power reactor, to investigate both the flow mixing and Flow Induced Vibration (FIV), has been constructed. The scale model has To preserve the flow rate distribution in a scaled instrumented both for the flow mixing and the reactor model, the L/D aspect ratio of should be held pressure perturbation measurements as well as to 1. structure vibration measurements. The overall goal of 𝐵𝑡𝑞𝑓𝑑𝑢 𝑠𝑏𝑢𝑗𝑝 = (𝑀 𝐸 ⁄ ) 𝑆 = 1 the scale model tests is to set up the scaling method and instrumentation skills for FIV test such as Comprehensive Vibration Assessment Program (CVAP) scaled model tests. The data on the Table 1 Scaling parameters of the 1/5-scale model [1] turbulence-induced pressure perturbation in functions Parameter Proto 1/5 Model Ratio of Power Spectral Density (PSD) needs to determine Length L Ref 1/5 l R the vibration level by the excitation pressure Area A Ref 1/25 l 2R perturbation onto an internal structure such as the core barrel inside a reactor vessel. Work by Au Yang, Aspect Ratio (L/D) Ref 1 1 and more recent work, has shown that model test R PSD correlations are not an accurate predictor of Velocity V R 1 1/2R /SQRT(5) turbulence PSDs in the full-scale plant [2.3]. Work by Snyder et al. [4,5] has shown, for instance, that Density REF 1.3 R turbulence flow vorticity may be a useful parameter Viscosity REF 5.26 R and could leader to the development of more accurate PSD correlations. Further investigation of the utility of vorticity is recommended.
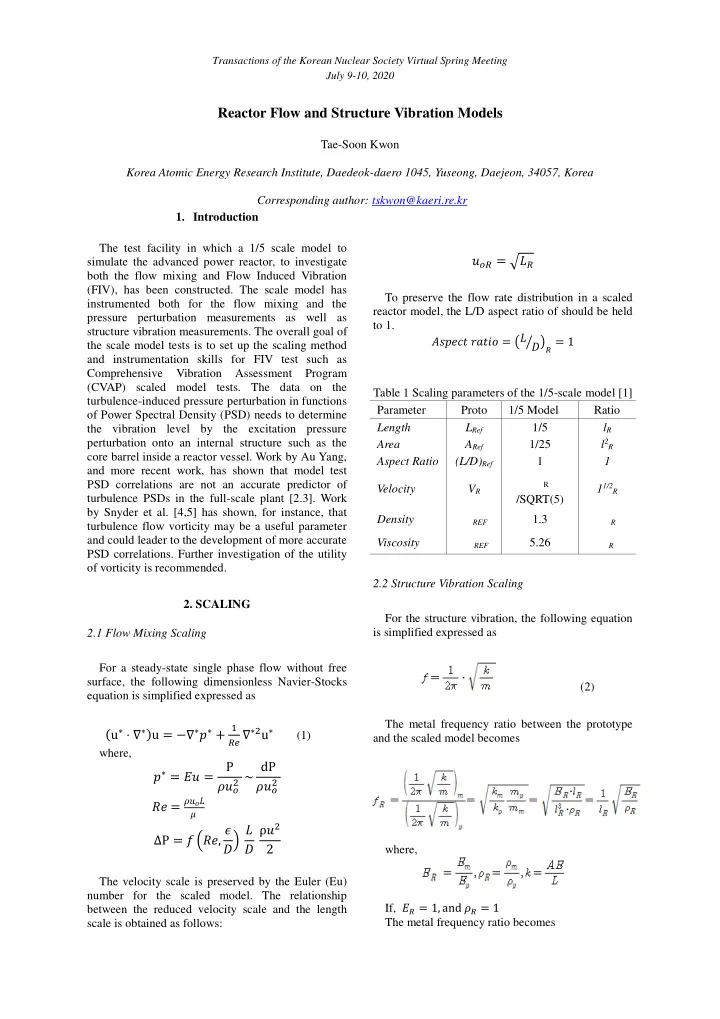
 2.2 Structure Vibration Scaling 2. SCALING For the structure vibration, the following equation is simplified expressed as 2.1 Flow Mixing Scaling For a steady-state single phase flow without free surface, the following dimensionless Navier-Stocks (2) equation is simplified expressed as The metal frequency ratio between the prototype (u ∗ ⋅ ∇ ∗ )u = −∇ ∗ 𝑞 ∗ + 1 𝑆𝑓 ∇ ∗2 u ∗ (1) and the scaled model becomes where, P 2 ~ dP 𝑞 ∗ = 𝐹𝑣 = 2 𝜍𝑣 𝑝 𝜍𝑣 𝑝 𝑆𝑓 = 𝜍𝑣 𝑝 𝑀 𝜈 𝐸 ρ𝑣 2 ∆P = 𝑔 (𝑆𝑓, 𝜗 𝐸) 𝑀 2 where, The velocity scale is preserved by the Euler (Eu) number for the scaled model. The relationship If, 𝐹 𝑆 = 1, and 𝜍 𝑆 = 1 between the reduced velocity scale and the length scale is obtained as follows: The metal frequency ratio becomes

  2. Transactions of the Korean Nuclear Society Virtual Spring Meeting July 9-10, 2020 contour and patterns compared to those of the prototype. The borated water injected into the reactor vessel through a DVI nozzle was not mixed evenly over the core and downcomer section. 2.3 Turbulence Pressure Perturbation Scaling The Euler number to be an approximate function of the reduced frequency, thus    p f   Eu F    2   V V (3) f The normalized PSD was defined as  G ( ) f f    p ( ) f ; f p    2  V 2   V  f    4      2  V (4) (a) Prototype(Full scale) (b)1/5-scale model Fig.1 Flow distribution in the downcomer This leads to the following similarity relation between model (M) and prototype (P): 3.2 Structure Vibration Similarity    ( ) f ( ) f p P p M Table 2 summarized the natural frequency of the 3 V   P G ( ) f G ( ) f full scale model and the 1/5 scale model. The p P p M 3 (5) V M frequency of the scaled model is amplified by 5 times  f f when compared those of the full scale model because P M   the length scale is 1/5. Fig.2 show the vibration f f  mode shapes of the core barrel. V V P M Table 2 Modal frequency The rms turbulence pressure can be obtained from the pressure PSD via the integral: 1/5 Mode Proto Ratio model (circumf., axial) (b) (a)/(b) (a) 1 61.0 12.2 5.00 (2, 0) 2 62.0 12.4 5.00 (6) 3 94.2 18.8 5.00 (2, 1) The Eu scaling above may not fully capture the 4 94.6 18.9 5.00 relation between model and prototype turbulence 5 162.1 32.4 5.00 pressures. Frequency effects, for example, may cause (3, 0) distortion of the Eu scaling. At the same time, such 6 165.5 33.1 5.00 distortion may provide information on differences in 7 225.1 45.0 5.00 turbulence generation and excitation mechanisms (3, 1) between model and prototype. The Kolmogorov 8 228.4 45.7 5.00 cascade power law may be valid in the reactor downcomer Sugiura et al. [6] 9 284.5 56.9 5.00 (2, 2) 10 290.2 58.0 5.00 3. Results 3.1 Mean Flow Similarity Fig. 1 shows the downcomer flow distribution that simulated by CFX code. As shown in the figure, the flow distribution of scaled model had a very similar

  3. Transactions of the Korean Nuclear Society Virtual Spring Meeting July 9-10, 2020 [4] Synder, M., et al., 2003, AP1000 reactor internals FIV program, Intl. Cong. On Adv. In Nuclear Power Plants, Cordoba, Spain, may 4-7, Paper No. 3346. [5]Snyder, M., et al., 2004, Progress in the generation of flow turbulence excitation forces fro CFD analyses and experimental data, the 6th. Int. Conf. on Nuclear Thermal Hydraulic, Operations & Safety (NUTHOS-6), Nara, Japan, Oct.4-8. Paper ID.000127. [6]Sugiura H., et al., 2018, Development of structural integrity assessment method for flow-induced vibration of reactor internals in PWR, Proc. PVP Conf. PVP2018, Paper PVP2018-84473, Prague, Czech Republic. Fig.2 Mode shapes of vibration. 4. Conclusions The CFD analysis performed to evaluate the mixing similarity of the downcomer and core driven by the CVCS and SCS for prototype and 1/5-scale models. For the CVCS and SCS pump running forced flow conditions, the flow distributions in the reactor core and the downcomer were well preserved for the 1/5-linear scaled model. The borated water injected through the DVI nozzle (for the SCS) and the cold leg (for the CVCS) was not mixed evenly over the core section. However, the flow patterns of the core zone with a free cavity and mixing vane models were well preserved between the prototype and 1/5-Scale models. REFERENCES [1] K.H. Kim, D.J. Euh, I.C., Chu, Y.J. Youn, H.S. C. hoi, Tae-Soon. Kwon, “ Experimental study of the APR+ reactor core flow and pressure distributions under 4-pump running conditions, ” Nuclear Engineering and Design, Vol. 265, pp. 957-966 (2013). Journal Paper [2] Au Yang, M.K., Jordan, K.B., 1980, Dynamic pressure inside a PWR-a study based on laboratory and field test data, Nuclear Engineering and Design, Vol.58, pp.113-125. [3] Au Yang, M.K., Brenneman, B, & Raj, D., 1995, Flow-induced vibration of an advanced water reactor model, Part I: turbulence-induced forcing function, Nuclear Engineering and Design, Vol.157, pp.93-109.

Download Presentation
Download Policy: The content available on the website is offered to you 'AS IS' for your personal information and use only. It cannot be commercialized, licensed, or distributed on other websites without prior consent from the author. To download a presentation, simply click this link. If you encounter any difficulties during the download process, it's possible that the publisher has removed the file from their server.

Recommend


More recommend