
RECOMMENDATION ON ESSENTIAL NUTRIENT (IOM)
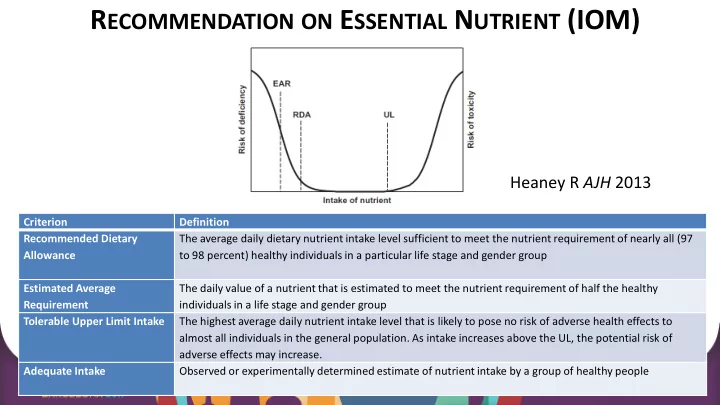
Criterion Definition Recommended Dietary Allowance The average daily dietary nutrient intake level sufficient to meet the nutrient requirement of nearly all (97 to 98 percent) healthy individuals in a particular life stage and gender group Estimated Average Requirement The daily value of a nutrient that is estimated to meet the nutrient requirement of half the healthy individuals in a life stage and gender group Tolerable Upper Limit Intake The highest average daily nutrient intake level that is likely to pose no risk of adverse health effects to almost all individuals in the general population. As intake increases above the UL, the potential risk of adverse effects may increase. Adequate Intake Observed or experimentally determined estimate of nutrient intake by a group of healthy people
Heaney R AJH 2013