Questions 1 On your computer or smartphone open up a new window - - PowerPoint PPT Presentation
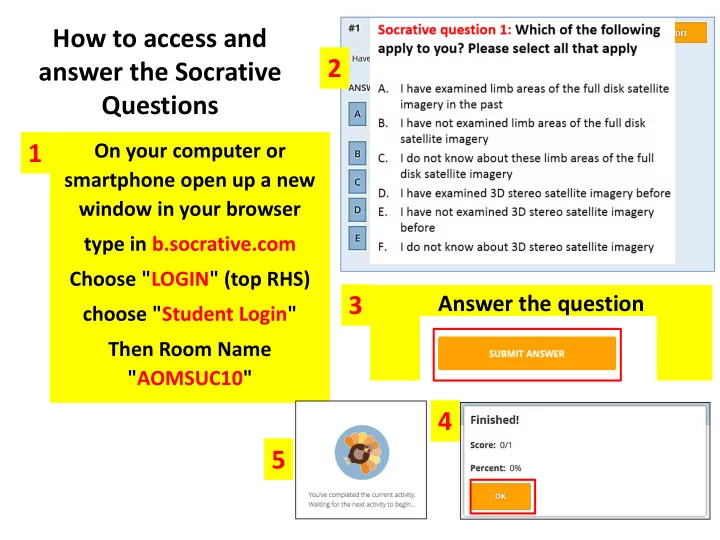
How to access and 2 answer the Socrative Questions 1 On your computer or smartphone open up a new window in your browser type in b.socrative.com Choose "LOGIN" (top RHS) 3 Answer the question choose "Student Login"
Socrative question 1: Which of the following apply to you? Please select all that apply
A. I have examined limb areas of the full disk satellite imagery before B. I have not examined limb areas of the full disk satellite imagery C. I do not know about these limb areas of the full disk satellite imagery D. I have examined 3D stereo satellite imagery before E. I have not examined 3D stereo satellite imagery F. I do not know about 3D stereo satellite imagery
REFERENCE SLIDE
Future developments: Multiple geostationary satellite platforms
Exploring "limb effects" and 3D stereo satellite imagery Bodo Zeschke
Bureau of Meteorology Training Centre Australian VLab Centre of Excellence
Content of this session
- The constellation of geostationary satellites over our
region
- Utilising limb effects for enhanced forecaster
monitoring
- Introducing the 3D stereo satellite imagery utilising
Himawari-8, Geo-KOMPSAT 2A, GOES-16 and 17 data
Content of this session
- The constellation of geostationary satellites over our
region
- Utilising limb effects for enhanced forecaster
monitoring
- Introducing the 3D stereo satellite imagery utilising
Himawari-8, Geo-KOMPSAT 2A, GOES-16 and 17 data
Feng-Yun-4A (105E) GOES-17 (137.2W)
Full earth disk view of the geostationary satellites over the Asia-Oceania (AOMSUC) region
Himawari-8 (140.7E) GEO-KOMPSAT-2A (128.2E)
Feng-Yun-4A (105E) GOES-17 (137.2W)
Full earth disk view of the geostationary satellites over our region and "limb regions" as defined by Elmer (2019)
Himawari-8 (140.7E) GEO-KOMPSAT-2A (128.2E)
Content of this session
- The constellation of geostationary satellites over our
region
- Utilising limb effects for enhanced forecaster
monitoring
- Introducing the 3D stereo satellite imagery utilising
Himawari-8, Geo-KOMPSAT 2A, GOES-16 and 17 data
Animation 1: The Ulawun eruption (PNG) rendered in the GOES-17 visible (Band 2) data 26th June 2019, Red Visible / 0.64 micron 0400 – 0740UTC
animation courtesy Scott Bachmeier SSEC Wisconsin
Please start the Power Point Slide Show to activate the animation
Socrative question 2: What additional information is the earth full disk limb animation giving you?
Write in your answers here.
Animation 2: Comparing the JMA SO2 RGB composite utilising Himawari-8 and GOES-17 data: the Ulawun
eruption; 0430UTC to 2300UTC 26th June 2019
Please start the Power Point Slide Show to activate the animation
animation courtesy JMA/BOM
GOES-17 Himawari-8
Ulawun Ulawun Bougainville Bougainville animation courtesy RAMMB/CIRA @ CSU
Thick SO2 cloud Upper layer SO2 cloud
Comparing the JMA SO2 RGB composite utilising Himawari-8 and GOES-17 data:
the Ulawun eruption; 1720UTC 26th June 2019
image courtesy JMA/BOM image courtesy RAMMB/CIRA @ CSU
GOES-17 as displayed in RAMMB/CIRA SLIDER Himawari-8
Additional information provided by the GOES-17 satellite due to the limb effect
Ulawun Bougainville Bougainville Ulawun
Singapore thunderstorm event, 28th June 2017
at the time 16:20 LST, 0820UTC Comparing RADAR, Himawari-8 satellite and lightning data.
RADAR and precipitation data courtesy NEA Singapore
Tropical Sandwich Product
20km
satellite data courtesy BOM/JMA, lightning data from Weather Zone
24 hour precipitation (mm)
Parallax error issues near the limb
Singapore thunderstorm event, 0810UTC 28th June 2017 Satellite, RADAR and surface
- bservations
RADAR
image from Jedlovec et al. 2017 image from Elmer 2019 image from JMA