
SLIDE 1
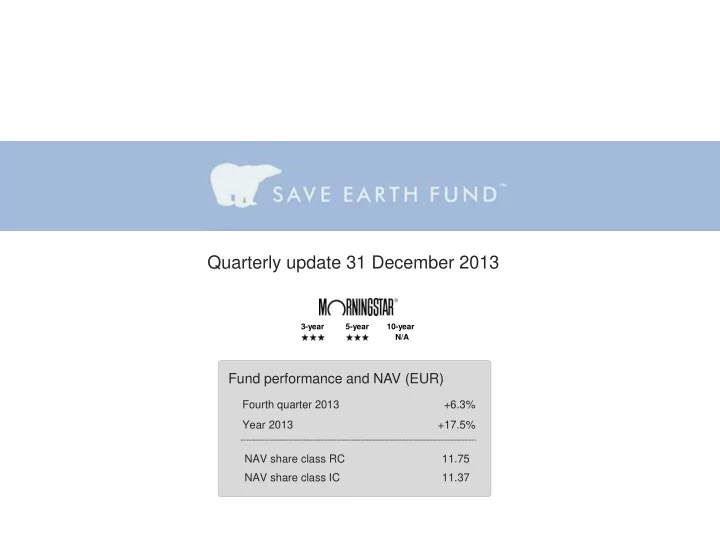
Quarterly update 31 December 2013
N/A 3-year 5-year 10-year
Fund performance and NAV (EUR)
Fourth quarter 2013 +6.3% Year 2013 +17.5% NAV share class RC 11.75 NAV share class IC 11.37
Quarterly update 31 December 2013 3-year 5-year 10-year N/A Fund - - PowerPoint PPT Presentation
Quarterly update 31 December 2013 3-year 5-year 10-year N/A Fund performance and NAV (EUR) Fourth quarter 2013 +6.3% Year 2013 +17.5% NAV share class RC 11.75 NAV share class IC 11.37 Save Earth Fund Performance Fund performance vs MSCI
N/A 3-year 5-year 10-year
Fourth quarter 2013 +6.3% Year 2013 +17.5% NAV share class RC 11.75 NAV share class IC 11.37
2
half of 2013, which was about 5% worse than MSCI World Net. During the period the best performing sector exposure was renewable energy, while the worst performing regional exposure was Asia.
fund gained 12.5%, which was about 3% better than MSCI World
be contributed mostly to the exposure against environmental technology in Europe, but renewable energy continued to perform very well too. Our exposure to Asia continued to underperform MSCI World.
best contributor to the fund’s
contributor, especially environmental technology in the region.
Source: MSCI, CB Fonder
+17.5% +21.2%
3
world, SCA writes in its magazine Shape. Fresh water is a scarce commodity. Only 2.5% of the water on the planet is fresh and most of it is in glaciers and polar ice caps. Gustaf Olsson, professor in industrial automation at Lund university in Sweden, makes the following comparison: ”If all the water in the world would fit into a 10-liter container, all the accessible freshwater in our rivers and lakes would fill a one millilitre measuring spoon.” Read more…
(WHO). Air pollution was responsible for 3.2 million deaths in 2010 and of those 223 000 was caused by lung cancer. Read more…
gas sector, writes RobecoSAM. Canada – known for vast reserves of oil sands - is mentioned as an example. Another mentioned fact is that one produced barrel of oil require one barrel of water. Read more…
and has never reached as high temperatures. The temperature was 0.78 degrees Celsius over the historical mean. Read more…
4
In the green countries solar energy is competitive with conventional energy without subsidies; in the red countries solar energy is not competitive. The grey countries are not analysed. The yellow boxes show population and the cost savings, in percent, that can be achieved if conventional energy is replaced with solar
5
Energy revolution! ”The falling satellite” below (grey line) shows how the cost of solar energy has developed over time. It is still more expensive than conventional energy, however, the trend is evident for solar energy (down) and conventional energy (up). The graph is as of 2012; according to the author of the analysis solar energy was cheaper than oil globally at the end of 2013 and cheaper than natural gas in Asia at the same time, measured as $/MMBTU. And most importantly: this trend will continue for years to come.
Source: EIA, CIA, World Bank, Bernstein analysis
Index
6
Index
7 +17.5%
+53.4% +1.1% +43.6%
8
Source: CB Fonder, Lipper, MSCI *Monthly data from Lipper for the period 30 June 2008 – 31 December 2013, in EUR.
have performed very poorly – the exception is the water sector that has performed well. Our ambition is that the fund shall be a low risk alternative in a high risk sector – in this we have succeeded. However, the performance has so far not met
the environmental sector since fund inception, 2013 was an encouraging year. For the first time since 2009 both environmental technology and renewable energy
trend reversal. The fund performed in line with the broad market indices, with low risk.
9
Source: CB Fonder, Lipper
*Monthly data from Lipper for the period 30 June 2008 – 31 December 2013, in EUR.
10
*Including cash in underlying funds. As of December 2013 As of December 2013
11
shale gas in USA that demand enormous amounts of water (11-19 million litres of water per drill hole). The water companies take advantage mainly in two ways:
from the drill holes, which requires infrastructure in the form of water pipes.
added to the water, which requires treatment of the water after use.
efficiency have often much experience and also world leading technologies in the area, because of the demanding European regulation.
Company Country Sector Market cap (billion €) USA Water 11.1 Germany Cleantech 0.3 Germany Cleantech 0.4 Netherlands Cleantech 1.8 Austria Renewable energy 4.7 USA Water 5.4 France Cleantech 6.1 Belgium Cleantech 0.9 USA Water 38.8 USA Cleantech 7.2
Pentair American Water Danaher Schaltbau Centrotec Arcadis Valeo Melexis
12
Source: CB Fonder, MSCI, Reuters *Monthly data from MSCI and Reuters for the period 31 December 2008 – 31 December 2013, in EUR.
Europe and USA are the regions we mainly allocate between, of which the fund has the highest correlation with Asia followed by Europe.
correlation with MSCI World. In the fund we have, and have had, high exposure to the sector which explains the fund’s high correlation with both MSCI World and S&P Global Water index. Renewable energy differ from both the water sector and MSCI World mainly because of the sector’s immature characteristics, with young companies and volatile stock prices.
Save Earth Fund World Europe USA Asia Save Earth Fund 1.00 0.88 0.81 0.79 0.85 World 1.00 0.88 0.94 0.86 Europe 1.00 0.69 0.75 USA 1.00 0.74 Asia 1.00 Save Earth Fund MSCI World WilderHill New Energy S&P Global Water Cleantech index Save Earth Fund 1.00 0.88 0.82 0.90 0.88 MSCI World 1.00 0.72 0.87 0.85 WilderHill New Energy 1.00 0.67 0.88 S&P Global Water 1.00 0.84 Cleantech index 1.00
13
8.1% 6.6% +0.59
*36 months data on a 60-day rolling basis (EUR)
14
free to allocate between the sectors renewable energy, cleantech and water management, as well as geographically.
management
level (standard deviation) is in line with the world index (MSCI World) and significantly lower than that of peers.
for global equities in general. At the moment we see several growth enhancing trends, such as severe and alarming air pollution in China and huge needs for water treatment in the wake of the shale gas boom in the US.
15
CB Save Earth Fund, RC
eternal and both absolute and relative High-Water Mark
CB Save Earth Fund, IC
and relative High-Water Mark
16
CB Save Earth Fund
CB Asset Management AB
Luxembourg
SEB Fund Service, Luxembourg
PricewaterhouseCoopers S.ár.I.
UCITS IV
EUR
Daily/Daily
June 9, 2008
RC: None, IC: €500 000
RC: LU0354788688 / 913218.FBF / CBSVERC LX IC: LU0354788506 / 68173241 / CBSICAE LX
17
This document is neither an offer to sell nor a solicitation to invest. Such offers or solicitations must be preceded or accompanied by a current offering document of the funds. This document is submitted to you confidentially solely in connection with your consideration of an investment in Save Earth Fund (the “Fund”). The preceding/upcoming pages constitute a summary only. No assurance can be given that the investment objective will be achieved, and investment results may vary substantially over any given time
fees that will reduce returns. The fund’s performance may be volatile.