
SLIDE 1
Glycan Analysis Services:
Quantitative Monosaccharide Analysis
GlcN
Mono-Mix Standard
GalN Gal ManGlc Fuc 2AA
Quantitative Monosaccharide Analysis Mono-Mix 2AA GlcN GalN - - PowerPoint PPT Presentation
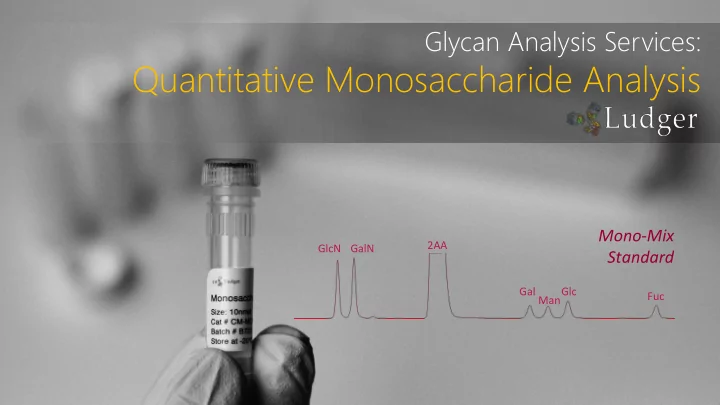
Glycan Analysis Services: Quantitative Monosaccharide Analysis Mono-Mix 2AA GlcN GalN Standard Gal ManGlc Fuc Quantitative Monosaccharide Analysis and why it is important ICH guideline Q6B states that the carbohydrate content (neutral
GlcN
GalN Gal ManGlc Fuc 2AA
Glycan Analysis Services – Monosaccharide Analysis |
2
ICH guideline Q6B states that the carbohydrate content (neutral sugars, amino sugars, and sialic acids) should be determined for glycoprotein biopharmaceuticals. This provides information relating to the types of N- and/or O-glycans present on a glycoprotein. Changes in glycosylation can have a significant affect on both the physiochemical and biological properties of a glycoprotein. It is therefore important to monitor the monosaccharide content during all stages of the product life cycle as well as QC batch to batch consistency. The major monosaccharides that make up N-glycans and O-glycans are the neutral monosaccharides N-acetylglucosamine (GlcNAc), N- acetylgalactosamine (GalNAc), galactose (Gal), glucose (Glc), mannose (Man) and fucose (Fuc); plus sialic acids. For monosaccharide analysis these sugars are released from the protein by acid hydrolysis. Sialic acids are released under milder conditions than those used to release neutral sugars as sialic acids are destroyed under the conditions required for neutral monosaccharide release, therefore sialic acid quantification is performed separately (view our presentation on Quantitative Sialic Acid Analysis). Neutral sugars are hydrolysed by incubation with trifluoroacetic acid (TFA) or hydrochloric acid (HCl). Usually 3 hour incubation at 100 °C with 2M TFA will release all of the monosaccharides. If harsher conditions are required (as can be the case to completely remove the core N-acetylhexosamines which are directly attached to the protein) 6M HCL can be used, however there will be degradation of the hexose sugars under these conditions, therefore release conditions may require optimising for individual glycoproteins. Also during hydrolysis, N- acetyl groups on GlcNAc and GalNAc are hydrolysed to glucosamine (GlcN) and galactosamine (GalN). When quantifying monosaccharides it is important to subject any monosaccharide standards to the same hydrolysis conditions as the glycoproteins as the different sugars degrade at different rates and have different molar fluorescence.
Glycan Analysis Services – Monosaccharide Analysis |
3
Neutral monosaccharides are released from the glycoprotein by acid hydrolysis using: 2M trifluoroacetic acid (TFA) or 6M hydrochloric acid (HCl) Samples are labelled with the fluorescent 2AA tag Samples are run on RP-LC Data analysis. The absolute amounts of monosaccharides N-acetylglucosamine (GlcN); N-acetylgalactosamine (GalN); galactose (Gal), mannose (Man), glucose (Glc) and fucose (Fuc) are calculated by reference to standard curves from Mono-Mix quantitative standard.
Glycan Analysis Services – Monosaccharide Analysis |
GlcN
Fluorescence
Mono-Mix Standard
Fetuin
TFA Release nmol/mg protein
Monosaccharide Average %CV
GlcN 260 1.3 GalN 50 1.3 Gal 409 6.6 Man 288 5.4 Glc 13 14.5 Fuc 14 2.1
Monosaccharides quantified in nmol/mg protein by reference to standard curves
4
Minutes 6.00 8.00 10.00 12.00 14.00 16.00 18.00 20.00 22.00 24.00
GalN Gal Man Glc Fuc 2AA GlcN GalN Gal Man Glc Fuc 2AA
Glycan Analysis Services – Monosaccharide Analysis |
GlcN
Fluorescence
Mono-Mix Standard
Fetuin
HCl Release nmol/mg protein
Monosaccharide Average %CV
GlcN 336 13.1 GalN 70 17.2
Gal*
1071 30.0
Man*
486 27.7
Glc*
8 92.4
Fuc*
protein by reference to standard curves
5
Minutes 6.00 8.00 10.00 12.00 14.00 16.00 18.00 20.00 22.00 24.00
GalN Gal Man Glc Fuc GlcN GalN Gal Man Glc Fuc 2AA 2AA HCl may be required to ensure that the core monosaccharide is fully released (particularly when O-glycans are present). *A side effect of using the stronger acid is that decomposition of the hexose sugars can occur, so the data is not accurate for the hexose sugars.
Glycan Analysis Services – Monosaccharide Analysis |
6
The combined data from both releases in in good agreement with published values.
where the stronger acid release more of the core sugars.
Where there is less degradation than with the HCl release. Fetuin has both N- and O-glycans. On this protein the GalN is from O-glycans. Glc is present as a background contaminant and is also detected in the negative controls.
HCL & TFA
Release Data nmol/mg protein Amount Relative to CARC^ Fetuin Analysis
Monosaccharide Average %CV Relative %
GlcN 336 13.1 78 GalN 70 17.2 105 Gal 409 6.6 132 Man 288 5.4 120 Glc 13 14.5
14 2.1
Glycan Analysis Services – Monosaccharide Analysis |
TFA Release nmol/mg protein
Monosaccharide Average %CV
GlcN 47 1.7 GalN 8 0.5 Gal 24 2.4 Man 41 1.6 Glc 5 9.2 Fuc 6 1.3
7
GlcN
Fluorescence
Mono-Mix Standard
IgG
GalN GalManGlc Fuc 2AA GlcN GalN Gal ManGlc Fuc 2AA
Minutes 6.00 8.00 10.00 12.00 14.00 16.00 18.00 20.00 22.00 24.00
Monosaccharides quantified in nmol/mg protein by reference to standard curves
Glycan Analysis Services – Monosaccharide Analysis |
HCl Release nmol/mg protein
Monosaccharide Average %CV
GlcN 58 2.1 GalN 3 2.0 Gal*
28 7.5
Man*
54 1.6
Glc*
19 34.3
Fuc*
20 18.0
8
HCl may be required to ensure that the core monosaccharide is fully released (particularly when O-glycans are present). *A side effect of using the stronger acid is that decomposition
the hexose sugars. GlcN
Fluorescence
Mono-Mix Standard
IgG
GalN GalManGlc Fuc 2AA GlcN GalN Gal ManGlc Fuc 2AA
Minutes 6.00 8.00 10.00 12.00 14.00 16.00 18.00 20.00 22.00 24.00
Monosaccharides quantified in nmol/mg protein by reference to standard curves
Glycan Analysis Services – Monosaccharide Analysis |
9
The combined data from both releases in in good agreement with data from N-glycan analysis.
stronger acid releases more of the core sugars.
glycans, hence a low, but real GalN value.
degradation than with the HCl release.
low % of high mannose structures present.
in the negative controls.
HCL & TFA
Release Data nmol/mg protein Number of monosaccharides per N-glycan site
Monosaccharide Average %CV Number per site
GlcN 58 2.1 4.4 GalN 3 2.0 0.2 Gal 24 2.4 1.8 Man 41 1.6 3.1 Glc 5 9.2 0.4 Fuc 6 1.3 1.2