Q4 2018 Q4 2017 Change % 2018 2017 Change % Key figures - - PDF document

q4 2018 q4 2017 change 2018 2017 change key figures
SMART_READER_LITE
LIVE PREVIEW

Q4 2018 Q4 2017 Change % 2018 2017 Change % Key figures - - PDF document

Q4 2018 Q4 2017 Change % 2018 2017 Change % Key figures Revenue and profitability 683,1 645,3 2 834,6 2 568,4 Revenue, EUR million 5,8 10,4 Comparable operating result, EUR million 9,2 22,9 -59,9 169,4 170,4 -0,6 1,3 3,5 6,0


slide-1
SLIDE 1

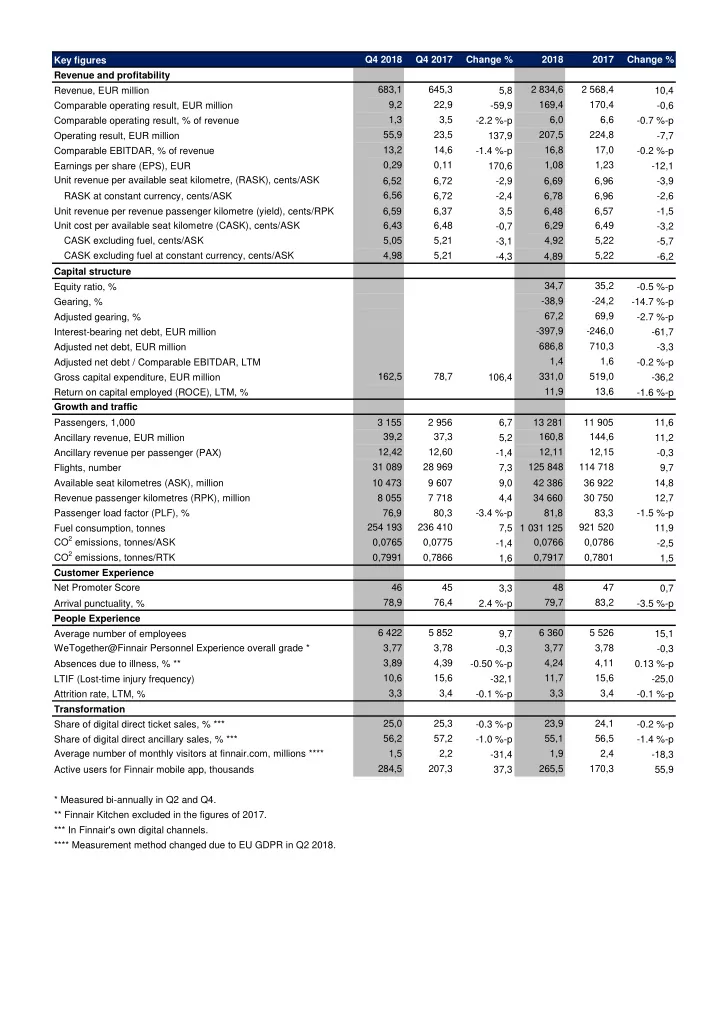
Key figures Q4 2018 Q4 2017 Change % 2018 2017 Change % Revenue and profitability Revenue, EUR million 683,1 645,3 5,8 2 834,6 2 568,4 10,4 Comparable operating result, EUR million 9,2 22,9

  • 59,9

169,4 170,4

  • 0,6

Comparable operating result, % of revenue 1,3 3,5

  • 2.2 %-p

6,0 6,6

  • 0.7 %-p

Operating result, EUR million 55,9 23,5 137,9 207,5 224,8

  • 7,7

Comparable EBITDAR, % of revenue 13,2 14,6

  • 1.4 %-p

16,8 17,0

  • 0.2 %-p

Earnings per share (EPS), EUR 0,29 0,11 170,6 1,08 1,23

  • 12,1

Unit revenue per available seat kilometre, (RASK), cents/ASK 6,52 6,72

  • 2,9

6,69 6,96

  • 3,9

RASK at constant currency, cents/ASK 6,56 6,72

  • 2,4

6,78 6,96

  • 2,6

Unit revenue per revenue passenger kilometre (yield), cents/RPK 6,59 6,37 3,5 6,48 6,57

  • 1,5

Unit cost per available seat kilometre (CASK), cents/ASK 6,43 6,48

  • 0,7

6,29 6,49

  • 3,2

CASK excluding fuel, cents/ASK 5,05 5,21

  • 3,1

4,92 5,22

  • 5,7

CASK excluding fuel at constant currency, cents/ASK 4,98 5,21

  • 4,3

4,89 5,22

  • 6,2

Capital structure Equity ratio, % 34,7 35,2

  • 0.5 %-p

Gearing, %

  • 38,9
  • 24,2
  • 14.7 %-p

Adjusted gearing, % 67,2 69,9

  • 2.7 %-p

Interest-bearing net debt, EUR million

  • 397,9
  • 246,0
  • 61,7

Adjusted net debt, EUR million 686,8 710,3

  • 3,3

Adjusted net debt / Comparable EBITDAR, LTM 1,4 1,6

  • 0.2 %-p

Gross capital expenditure, EUR million 162,5 78,7 106,4 331,0 519,0

  • 36,2

Return on capital employed (ROCE), LTM, % 11,9 13,6

  • 1.6 %-p

Growth and traffic Passengers, 1,000 3 155 2 956 6,7 13 281 11 905 11,6 Ancillary revenue, EUR million 39,2 37,3 5,2 160,8 144,6 11,2 Ancillary revenue per passenger (PAX) 12,42 12,60

  • 1,4

12,11 12,15

  • 0,3

Flights, number 31 089 28 969 7,3 125 848 114 718 9,7 Available seat kilometres (ASK), million 10 473 9 607 9,0 42 386 36 922 14,8 Revenue passenger kilometres (RPK), million 8 055 7 718 4,4 34 660 30 750 12,7 Passenger load factor (PLF), % 76,9 80,3

  • 3.4 %-p

81,8 83,3

  • 1.5 %-p

Fuel consumption, tonnes 254 193 236 410 7,5 1 031 125 921 520 11,9 CO2 emissions, tonnes/ASK 0,0765 0,0775

  • 1,4

0,0766 0,0786

  • 2,5

CO2 emissions, tonnes/RTK 0,7991 0,7866 1,6 0,7917 0,7801 1,5 Customer Experience Net Promoter Score 46 45 3,3 48 47 0,7 Arrival punctuality, % 78,9 76,4 2.4 %-p 79,7 83,2

  • 3.5 %-p

People Experience Average number of employees 6 422 5 852 9,7 6 360 5 526 15,1 WeTogether@Finnair Personnel Experience overall grade * 3,77 3,78

  • 0,3

3,77 3,78

  • 0,3

Absences due to illness, % ** 3,89 4,39

  • 0.50 %-p

4,24 4,11 0.13 %-p LTIF (Lost-time injury frequency) 10,6 15,6

  • 32,1

11,7 15,6

  • 25,0

Attrition rate, LTM, % 3,3 3,4

  • 0.1 %-p

3,3 3,4

  • 0.1 %-p

Transformation Share of digital direct ticket sales, % *** 25,0 25,3

  • 0.3 %-p

23,9 24,1

  • 0.2 %-p

Share of digital direct ancillary sales, % *** 56,2 57,2

  • 1.0 %-p

55,1 56,5

  • 1.4 %-p

Average number of monthly visitors at finnair.com, millions **** 1,5 2,2

  • 31,4

1,9 2,4

  • 18,3

Active users for Finnair mobile app, thousands 284,5 207,3 37,3 265,5 170,3 55,9 * Measured bi-annually in Q2 and Q4. ** Finnair Kitchen excluded in the figures of 2017. *** In Finnair's own digital channels. **** Measurement method changed due to EU GDPR in Q2 2018.

slide-2
SLIDE 2

CONSOLIDATED INCOME STATEMENT in mill. EUR Q4 2018 Q4 2017 Change % 2018 2017 Change % Revenue 683,1 645,3 5,8 2 834,6 2 568,4 10,4 Other operating income 18,6 19,8

  • 5,8

73,7 77,0

  • 4,2

Operating expenses Staff costs

  • 102,3
  • 113,0
  • 9,5
  • 433,4
  • 423,3

2,4 Fuel costs

  • 145,4
  • 122,3

18,9

  • 581,0
  • 472,2

23,1 Other rents

  • 40,9
  • 38,4

6,5

  • 154,9
  • 157,9
  • 1,9

Aircraft materials and overhaul

  • 47,1
  • 40,7

15,5

  • 169,1
  • 165,7

2,0 Traffic charges

  • 74,4
  • 67,0

11,1

  • 300,8
  • 266,5

12,9 Ground handling and catering expenses

  • 65,4
  • 62,7

4,4

  • 256,9
  • 252,2

1,9 Expenses for tour operations

  • 27,8
  • 27,7

0,4

  • 113,4
  • 100,5

12,9 Sales and marketing expenses

  • 25,2
  • 25,5
  • 1,0
  • 92,4
  • 85,8

7,7 Other expenses

  • 83,1
  • 73,9

12,6

  • 330,9
  • 285,1

16,1 Comparable EBITDAR 90,0 94,0

  • 4,2

475,4 436,2 9,0 Lease payments for aircraft

  • 38,5
  • 36,1

6,5

  • 155,0
  • 136,6

13,4 Depreciation and impairment

  • 42,4
  • 34,9

21,2

  • 151,1
  • 129,2

16,9 Comparable operating result 9,2 22,9

  • 59,9

169,4 170,4

  • 0,6

Unrealized changes in foreign currencies of fleet overhaul provisions

  • 1,1

1,5 <-200 %

  • 4,7

10,9 <-200 % Fair value changes of derivatives where hedge accounting is not applied 4,1

  • 1,2

> 200 % 0,2 0,3

  • 35,7

Sales gains and losses on aircraft and other transactions 43,2 0,6 > 200 % 42,7 44,1

  • 3,1

Restructuring costs 0,4

  • 0,3

> 200 %

  • 0,1
  • 0,9

84,6 Operating result 55,9 23,5 137,9 207,5 224,8

  • 7,7

Financial income

  • 1,1
  • 0,1

<-200 %

  • 2,9
  • 0,3

<-200 % Financial expenses

  • 3,4
  • 2,6
  • 29,2
  • 16,0
  • 13,4
  • 19,8

Result before taxes 51,3 20,7 147,6 188,6 211,1

  • 10,7

Income taxes

  • 10,5
  • 3,6
  • 187,4
  • 37,9
  • 41,7

9,1 Result for the period 40,8 17,1 139,1 150,7 169,4

  • 11,1

Attributable to Owners of the parent company 40,8 17,1 139,1 150,7 169,4

  • 11,1

Earnings per share attributable to shareholders of the parent company, EUR (basic and diluted) 0,29 0,11 170,6 1,08 1,23

  • 12,1

CONSOLIDATED STATEMENT OF COMPREHENSIVE INCOME in mill. EUR Q4 2018 Q4 2017 Change % 2018 2017 Change % Result for the period 40,8 17,1 139,1 150,7 169,4

  • 11,1

Other comprehensive income items Items that may be reclassified to profit or loss in subsequent periods Change in fair value of hedging instruments

  • 194,8

36,4 <-200 %

  • 113,5
  • 18,5

<-200 % Tax effect 39,0

  • 7,3

> 200 % 22,7 3,7 > 200 % Items that will not be reclassified to profit or loss in subsequent periods Actuarial gains and losses from defined benefit plans

  • 2,9

0,8 <-200 % 0,7 35,9

  • 98,0

Tax effect 0,6

  • 0,2

> 200 %

  • 0,1
  • 7,2

98,0 Other comprehensive income items total

  • 158,1

29,7 <-200 %

  • 90,2

14,0 <-200 % Comprehensive income for the period

  • 117,3

46,8 <-200 % 60,5 183,4

  • 67,0

Attributable to Owners of the parent company

  • 117,3

46,8 <-200 % 60,5 183,4

  • 67,0
slide-3
SLIDE 3

CONSOLIDATED BALANCE SHEET in mill. EUR 31 Dec 2018 31 Dec 2017 ASSETS Non-current assets Intangible assets O 20,4 15,5 Tangible assets O 1 526,6 1 422,1 Investments in associates and joint ventures O 3,3 2,5 Loan and other receivables O 4,3 5,6 Non-current assets total 1 554,7 1 445,7 Current assets Inventories O 25,1 17,2 Trade and other receivables O 242,2 319,8 Derivative financial instruments O/IA* 52,1 104,5 Other financial assets IA 892,2 833,0 Cash and cash equivalents IA 180,9 150,2 Current assets total 1 392,5 1 424,6 Assets held for sale O 0,1 16,7 Assets total 2 947,3 2 887,1 EQUITY AND LIABILITIES Equity attributable to owners of the parent Share capital E 75,4 75,4 Other equity E 946,2 940,3 Equity total 1 021,7 1 015,7 Non-current liabilities Deferred tax liabilities O 73,5 73,9 Interest-bearing liabilities IL 561,0 586,2 Pension obligations O 17,0 6,4 Provisions O 91,3 79,0 Other liabilities O 4,8 1,1 Non-current liabilities total 747,6 746,7 Current liabilities Provisions O 21,2 21,1 Interest-bearing liabilities IL 108,4 132,4 Trade payables O 72,6 90,7 Derivative financial instruments O/IL* 107,1 81,3 Deferred income and advances received O 548,9 475,3 Liabilities related to employee benefits O 105,6 139,2 Other liabilities O 214,2 173,4 Current liabilities total 1 178,0 1 113,4 Liabilities related to assets held for sale O 11,2 Liabilities total 1 925,6 1 871,4 Equity and liabilities total 2 947,3 2 887,1 Additional information to Balance Sheet: Interest-bearing net-debt and adjusted gearing 31 Dec 2018 31 Dec 2017 Interest-bearing liabilities 669,4 718,6 Cross currency Interest rate swaps * 5,8 18,5 Adjusted interest-bearing liabilities 675,2 737,1 Other financial assets

  • 892,2
  • 833,0

Cash and cash equivalents

  • 180,9
  • 150,2

Interest-bearing net debt

  • 397,9
  • 246,0

7 x Lease payments for aircraft for the last twelve months 1 084,7 956,4 Adjusted interest-bearing net debt 686,8 710,3 Equity total 1 021,7 1 015,7 Adjusted gearing, % 67,2 % 69,9 % Finnair reports its interest-bearing debt, net debt and adjusted gearing to give an overview of Finnair's financial position. Balance sheet items included in interest-bearing net debt are marked with an "IA" or "IL". The calculation of capital employed includes items marked with an "E" or "IL". Other items are marked with an "O". * Cross-currency interest rate swaps are used for hedging the currency and interest rate risk of interest-bearing loans, but hedge accounting is not applied. Changes in fair net value correlate with changes in the fair value of interest-bearing liabilities. Therefore, the fair net value of cross-currency interest rate swaps recognised in derivative assets/liabilities and reported in Note 5, is considered an interest-bearing liability in the net debt calculation.

slide-4
SLIDE 4

CONSOLIDATED STATEMENT OF CHANGES IN EQUITY in mill. EUR Share capital Other restricted funds Hedging reserve and

  • ther OCI

items Unrestricted equity funds Retained earnings Hybrid bond Equity total Equity 31 Dec 2017 75,4 168,1 63,0 250,3 260,7 198,2 1 015,7 Change in accounting principles 3,8

  • 4,7
  • 1,0

Equity 1 Jan 2018 75,4 168,1 63,0 254,0 256,0 198,2 1 014,7 Result for the period 150,7 150,7 Change in fair value of hedging instruments

  • 90,8
  • 90,8

Actuarial gains and losses from defined benefit plans 0,6 0,6 Comprehensive income for the period 0,0 0,0

  • 90,2

0,0 150,7 0,0 60,5 Hybrid bond interests and expenses

  • 12,6
  • 12,6

Dividend

  • 38,4
  • 38,4

Purchase of own shares

  • 3,7
  • 3,7

Share-based payments 1,1 1,1 Equity 31 Dec 2018 75,4 168,1

  • 27,2

255,2 351,9 198,2 1 021,7 in mill. EUR Share capital Other restricted funds Hedging reserve and

  • ther OCI

items Unrestricted equity funds Retained earnings Hybrid bond Equity total Equity 31 Dec 2016 75,4 168,1 33,9 248,6 132,8 198,2 857,0 Change in accounting principles 15,2

  • 16,1
  • 0,9

Equity 1 Jan 2017 75,4 168,1 49,0 248,6 116,6 198,2 856,1 Result for the period 169,4 169,4 Change in fair value of hedging instruments

  • 14,8
  • 14,8

Actuarial gains and losses from defined benefit plans 28,7 28,7 Comprehensive income for the period 0,0 0,0 14,0 0,0 169,4 0,0 183,4 Hybrid bond interests and expenses

  • 12,6
  • 12,6

Dividend

  • 12,8
  • 12,8

Share-based payments 1,6 1,6 Equity 31 Dec 2017 75,4 168,1 63,0 250,3 260,7 198,2 1 015,7 Retained earnings was adjusted with -4.7 million euros due to implementation of IFRS 15 Revenue from Contracts with Customers. Unrestricted equity funds increased 3.8 million euros due to amendment to IFRS 2 Share-based Payment. More detailed information in note 17. Changes in accounting principles.

slide-5
SLIDE 5

CONSOLIDATED CASH FLOW STATEMENT in mill. EUR Q4 2018 Q4 2017 2018 2017 Cash flow from operating activities Result for the period 40,8 17,1 150,7 169,4 Depreciation and impairment 42,4 34,9 151,1 129,2 Other adjustments to result for the period Financial income and expenses 4,5 2,7 18,9 13,6 Income taxes 10,5 3,6 37,9 41,7 EBITDA 98,2 58,4 358,6 353,9 Sales gains and losses on aircraft and other transactions

  • 43,2
  • 0,6
  • 42,7
  • 44,1

Non-cash transactions *

  • 4,5

9,3 25,7 33,4 Changes in working capital

  • 15,1

25,8 50,0 56,8 Financial expenses paid, net 2,2 0,3

  • 8,4
  • 17,1

Income taxes paid

  • 0,7
  • 0,7

Net cash flow from operating activities 37,5 92,6 383,1 382,3 Cash flow from investing activities Investments in intangible assets

  • 2,7
  • 2,3
  • 9,8
  • 11,3

Investments in tangible assets

  • 158,8
  • 57,5
  • 317,3
  • 393,6

Investments in group shares 0,8 0,1 7,5 Divestments of fixed assets and group shares 114,2 0,1 214,1 156,9 Net change in financial assets maturing after more than three months

  • 2,3
  • 26,8
  • 81,8

82,9 Change in non-current receivables 0,0 0,1 0,8 0,0 Net cash flow from investing activities

  • 49,5
  • 85,6
  • 194,0
  • 157,5

Cash flow from financing activities Proceeds from loans 199,3 Loan repayments and changes

  • 14,9
  • 12,0
  • 119,4
  • 130,0

Hybrid bond interests and expenses

  • 15,8
  • 15,8
  • 15,8
  • 15,8

Purchase of own shares

  • 3,7
  • 3,7

Dividends paid

  • 38,4
  • 12,8

Net cash flow from financing activities

  • 34,4
  • 27,7
  • 177,3

40,8 Change in cash flows

  • 46,4
  • 20,7

11,8 265,5 Liquid funds, at beginning 702,2 664,7 643,9 378,4 Change in cash flows

  • 46,4
  • 20,7

11,8 265,5 Liquid funds, at end ** 655,8 643,9 655,8 643,9 Notes to consolidated cash flow statement * Non-cash transactions Employee benefits

  • 7,9

1,9 3,0 16,0 Change in provisions 7,9 6,2 24,9 17,8 Other adjustments

  • 4,5

1,2

  • 2,1
  • 0,4

Total

  • 4,5

9,3 25,7 33,4 ** Liquid funds Other financial assets 892,2 833,0 892,2 833,0 Cash and cash equivalents 180,9 150,2 180,9 150,2 Cash funds 1 073,1 983,2 1 073,1 983,2 Maturing after more than three months

  • 417,3
  • 339,2
  • 417,3
  • 339,2

Liquid funds 655,8 643,9 655,8 643,9

slide-6
SLIDE 6

NOTES TO THE CONSOLIDATED FINANCIAL STATEMENTS BULLETIN

  • 1. BASICS OF PREPARATION
  • 2. ACCOUNTING PRINCIPLES
  • 3. CRITICAL ACCOUNTING ESTIMATES AND SOURCES OF UNCERTAINTY
  • 4. SEGMENT INFORMATION, REVENUE AND ITEMS AFFECTING COMPARABILITY

Revenue by product and traffic area Q4 2018, in mill. EUR Asia North Atlantic Europe Domestic Un- allocated Total Share % Passenger revenue 228,1 30,5 212,3 48,7 11,1 530,7 77,7 Ancillary and retail revenue 11,5 1,8 10,2 2,0 13,7 39,2 5,7 Cargo 47,7 3,5 10,0 0,2

  • 1,4

59,9 8,8 Travel services 7,9 3,0 39,8 0,4 2,1 53,2 7,8 Total 295,1 38,9 272,4 51,2 25,4 683,1 Share % 43,2 5,7 39,9 7,5 3,7 Q4 2017, in mill. EUR Asia North Atlantic Europe Domestic Un- allocated Total Share % Passenger revenue 212,5 25,9 202,4 49,5 1,0 491,3 76,1 Ancillary and retail revenue 10,3 1,8 10,0 1,1 14,0 37,3 5,8 Cargo 44,0 2,7 9,5 0,5 0,5 57,1 8,9 Travel services 12,2 5,9 41,1 0,2 0,3 59,6 9,2 Total 278,9 36,3 263,0 51,3 15,9 645,3 Share % 43,2 5,6 40,8 7,9 2,5 This Consolidated Financial Statements Bulletin has been prepared according to the International (IAS) Standard 34: Interim Financial Reporting. Consolidated income statement includes, in addition to operating result, comparable operating result and EBITDAR which are presented to better reflect the Group’s business performance when comparing results to previous periods. Comparable operating result does not include capital gains and losses, changes in the value of foreign currency denominated fleet maintenance reserves, changes in the unrealised fair value of derivatives or restructuring costs. The basis for this is explained in more detail in the note 4. Segment information, revenue and items affecting comparability. Comparable EBITDAR is a common measure in airline business which aims to reflect comparable operating result excluding capital cost, independent of whether aircraft are owned or leased. Therefore, comparable EBITDAR is calculated by excluding depreciations and operating lease payments for aircraft from comparable operating result. Finnair uses alternative performance measures referred to in the European Securities Markets Authority (ESMA) Guidelines on Alternative Performance Measures to describe its operational and financial performance, to provide a comparable view of its business and to enable better comparability relative to its industry peers. The alternative performance measures do not replace IFRS indicators. Finnair’s alternative performance measures reported in financial statements are comparable operating result and EBITDAR and adjusted net debt and gearing. Comparable operating result is reconciled in the note 4. Segment information, revenue and items affecting comparability. Finnair applies consistent principles when excluding items from comparable operating results. The principles are described in more detail in the note 4. Segment information, revenue and items affecting comparability. Adjusted gearing is used to measure Finnair’s indebtedness. In addition to interest-bearing loans, adjusted gearing also takes into account off- balance sheet lease commitments to better reflect Finnair’s financial position. Finnair reconciles the calculation of interest-bearing net debt and adjusted gearing by giving additional information to the balance sheet. Calculation principles of key ratios are also defined in the note 18. Calculation

  • f key ratios. Changes in accounting principles (see more in note 17) did not have an effect on calculating alternative performance measures.

Finnair Group adopted IFRS 15: Revenue from Contracts with Customers and amendment to IFRS 2: Share-based Payment, with a date of initial application on 1 January 2018. The following changes to the accounting principles are described in the note 17 Changes in accounting principles. Finnair also presents an evaluation of the upcoming implementation and effects of IFRS 16 standard IFRS 16 (Leases). The accounting principles applied are disclosed in the 2018 Consolidated Financial Statements. The figures presented in this statement are not rounded; therefore, the total sum of individual figures does not necessarily match the corresponding sum stated herein. The key figures stated here are calculated using the exact figures. The preparation of the Financial Statements Bulletin requires the company’s management to make estimates and assumptions that influence the levels of reported assets and liabilities as well as of revenue and expenses. The actual outcome may differ from the estimates made. The critical accounting estimates and sources of uncertainty are disclosed in the financial statements 2018. Finnair Executive Board, defined as the chief operative decision maker according to IFRS 8 Segment reporting, considers the business as one

  • perating segment. Therefore, segment information is not reported.
slide-7
SLIDE 7

2018, in mill. EUR Asia North Atlantic Europe Domestic Un- allocated Total Share % Passenger revenue 999,3 137,5 898,1 178,0 31,4 2 244,3 79,2 Ancillary and retail revenue 45,3 7,5 40,7 4,4 62,9 160,8 5,7 Cargo 155,7 12,0 32,4 0,6 6,2 206,9 7,3 Travel services 35,9 13,3 165,2 1,3 6,9 222,5 7,9 Total 1 236,2 170,3 1 136,4 184,4 107,4 2 834,6 Share % 43,6 6,0 40,1 6,5 3,8 2017, in mill. EUR Asia North Atlantic Europe Domestic Un- allocated Total Share % Passenger revenue 881,7 118,8 839,0 174,1 7,2 2 020,8 78,7 Ancillary and retail revenue 34,9 5,6 41,4 4,4 58,3 144,6 5,6 Cargo 147,1 10,9 31,0 1,8 6,5 197,4 7,7 Travel services 34,7 13,0 159,3 0,5

  • 1,9

205,6 8,0 Total 1 098,4 148,3 1 070,7 180,8 70,2 2 568,4 Share % 42,8 5,8 41,7 7,0 2,7 PLF, % Q4 2018 Q4 2017 Change % 2018 2017 Change % Asia 78,9 82,4

  • 3.5 %-p

85,5 86,7

  • 1.2 %-p

North Atlantic 78,6 79,0

  • 0.3 %-p

83,8 83,3 0.5 %-p Europe 75,7 79,4

  • 3.6 %-p

78,6 80,7

  • 2.1 %-p

Domestic 63,9 67,0

  • 3.1 %-p

64,7 67,4

  • 2.7 %-p

Total 76,9 80,3

  • 3.4 %-p

81,8 83,3

  • 1.5 %-p

ASK, mill. km Q4 2018 Q4 2017 Change % 2018 2017 Change % Asia 5 156,4 5 039,2 2,3 21 052,1 18 355,0 14,7 North Atlantic 762,1 722,1 5,5 3 135,6 2 776,1 13,0 Europe 4 036,4 3 384,6 19,3 16 297,8 14 152,0 15,2 Domestic 518,4 460,7 12,5 1 900,2 1 638,9 15,9 Total 10 473,3 9 606,7 9,0 42 385,8 36 922,0 14,8 RPK, mill. km Q4 2018 Q4 2017 Change % 2018 2017 Change % Asia 4 067,2 4 153,0

  • 2,1

17 999,6 15 911,3 13,1 North Atlantic 599,2 570,2 5,1 2 626,3 2 311,5 13,6 Europe 3 057,5 2 685,8 13,8 12 804,9 11 421,6 12,1 Domestic 331,5 308,7 7,4 1 229,5 1 105,2 11,2 Total 8 055,4 7 717,6 4,4 34 660,4 30 749,7 12,7 Key figures quarterly, last 24 months Q4 2018 Q3 2018 Q2 2018 Q1 2018 Q4 2017 Q3 2017 Q2 2017 Q1 2017 Revenue 683,1 801,2 715,0 635,3 645,3 735,4 633,4 554,4 Passenger revenue 530,7 651,8 577,2 484,6 491,3 597,7 509,2 422,6 Ancillary and retail revenue 39,2 42,0 40,5 39,1 37,3 37,4 36,2 33,8 Cargo 59,9 54,9 51,6 40,5 57,1 51,6 49,4 39,2 Travel services 53,2 52,5 45,6 71,2 59,6 48,7 38,5 58,8 Comparable operating result 9,2 108,4 47,9 3,9 22,9 118,9 37,5

  • 9,0

Operating result 55,9 105,7 39,9 6,0 23,5 122,2 89,1

  • 10,0

ASK, mill. km 10 473,3 11 528,0 10 718,7 9 665,7 9 606,7 10 092,9 9 094,8 8 127,7 RPK, mill. km 8 055,4 9 742,7 8 846,5 8 015,8 7 717,6 8 799,0 7 616,0 6 617,1 PLF, % 76,9 84,5 82,5 82,9 80,3 87,2 83,7 81,4

slide-8
SLIDE 8

Items affecting comparability in mill. EUR Operating result Items affecting compa- rability Compa- rable

  • perating

result Operating result Items affecting compa- rability Compa- rable

  • perating

result Change % 683,1 683,1 645,3 645,3 5,8 43,8

  • 43,8

0,0 1,1

  • 1,1

0,0 > 200 % 18,6 18,6 19,8 19,8

  • 5,8
  • 101,9
  • 0,4
  • 102,3
  • 113,3

0,3

  • 113,0
  • 10,1
  • 145,4
  • 145,4
  • 122,3
  • 122,3

18,9

  • 40,9
  • 40,9
  • 38,4
  • 38,4

6,5

  • 48,1

1,1

  • 47,1
  • 39,2
  • 1,5
  • 40,7

22,7

  • 74,4
  • 74,4
  • 67,0
  • 67,0

11,1

  • 65,4
  • 65,4
  • 62,7
  • 62,7

4,4

  • 27,8
  • 27,8
  • 27,7
  • 27,7

0,4

  • 25,2
  • 25,2
  • 25,5
  • 25,5
  • 1,0
  • 0,6

0,6 0,0

  • 0,5

0,5 0,0 10,8

  • 79,1
  • 4,1
  • 83,1
  • 75,1

1,2

  • 73,9

5,3 136,7

  • 46,7

90,0 94,5

  • 0,6

94,0 44,6

  • 38,5
  • 38,5
  • 36,1
  • 36,1

6,5

  • 42,4
  • 42,4
  • 34,9
  • 34,9

21,2 55,9

  • 46,7

9,2 23,5

  • 0,6

22,9 137,9 in mill. EUR Operating result Items affecting compa- rability Compa- rable

  • perating

result Operating result Items affecting compa- rability Compa- rable

  • perating

result Change % 2 834,6 2 834,6 2 568,4 2 568,4 10,4 44,1

  • 44,1

0,0 53,9

  • 53,9

0,0

  • 18,3

73,7 73,7 77,0 77,0

  • 4,2
  • 433,5

0,1

  • 433,4
  • 424,2

0,8

  • 423,3

2,2

  • 581,0
  • 581,0
  • 472,2
  • 472,2

23,1

  • 154,9
  • 154,9
  • 157,9
  • 157,9
  • 1,9
  • 173,8

4,7

  • 169,1
  • 154,9
  • 10,9
  • 165,7

12,2

  • 300,8
  • 300,8
  • 266,5
  • 266,5

12,9

  • 256,9
  • 256,9
  • 252,2
  • 252,2

1,9

  • 113,4
  • 113,4
  • 100,5
  • 100,5

12,9

  • 92,4
  • 92,4
  • 85,8
  • 85,8

7,7

  • 1,3

1,3 0,0

  • 9,8

9,8 0,0

  • 86,3
  • 330,8
  • 0,1
  • 330,9
  • 284,8
  • 0,2
  • 285,1

16,1 513,5

  • 38,1

475,4 490,6

  • 54,4

436,2 4,7

  • 155,0
  • 155,0
  • 136,6
  • 136,6

13,4

  • 151,1
  • 151,1
  • 129,2
  • 129,2

16,9 207,5

  • 38,1

169,4 224,8

  • 54,4

170,4

  • 7,7

EBITDAR Lease payments for aircraft Depreciation and impairment Operating result Traffic charges Ground handling and catering expenses Expenses for tour operations Sales and marketing expenses Sales losses on aircraft and other transactions Other expenses Aircraft materials and overhaul 2018 2017 Revenue Sales gains on aircraft and other transactions Other operating income Operating expenses Staff costs Fuel costs Other rents Operating result Sales and marketing expenses Sales losses on aircraft and other transactions Other expenses EBITDAR Lease payments for aircraft Depreciation and impairment Expenses for tour operations Revenue Sales gains on aircraft and other transactions Other operating income Operating expenses Staff costs Fuel costs Other rents Aircraft materials and overhaul Traffic charges Ground handling and catering expenses Comparable operating result aims to provide a comparable view on business development between periods. Therefore, items effecting comparability are excluded from the comparable operating result. The principles related to income statement presentation and principles related to usage of alternative preformance measures are described under Basics of preparation. Calculation principles of alternative performance measures are also defined in Note 18. Calculation of key ratios. The detailed content of items affecting comparability and the reasoning behind exluding those from comparable operating results is described below. Unrealised exchange rate differences of mainly in US dollars denominated aircraft maintenance provisions are not included in the comparable

  • perating result. These changes are not included in the comparable operating result until the maintenance event or redelivery occurs during a long

period of time in the future and the exchange rate differences realise over a long period of time. Finnair provides for the redelivery condition related to lease aircraft according to the principles described in the note 1.3.5. Provisions in the 2018 Consolidated Financial Statements. Further, unrealised fair value changes of derivatives where hedge accounting is not applied, are not included in the comparable operating result, as the business transactions which they are hedging are recognised to the comparable operating result only when they occur. The treatment of realised gains and losses on these derivatives is described in the note 3.8 Derivatives in the 2018 Consolidated Financial Statements. In addition to above, gains and losses on aircraft and other transactions and restructuring costs are not included in the comparable operating

  • result. Gains and losses on transactions include sales gains and losses as well as other items that can be considered to be directly related the sale of

the asset. For example, a write-down that might occur when an asset is classified as “Assets held for sale” in accordance with IFRS 5, is included in gains and losses on the transactions. Restructuring costs include termination benefits and other costs that directly related to the restructuring of

  • perations.

Q4 2018 Q4 2017

slide-9
SLIDE 9
  • 5. MANAGEMENT OF FINANCIAL RISKS

Derivatives, in mill. EUR Nominal value Fair net value Nominal value Fair net value Currency derivatives Operational cash flow hedging (forward contracts) 700,1 10,1 385,2

  • 10,5

Operational cash flow hedging (options) Bought options 242,6 5,6 195,1 5,1 Sold options 242,0

  • 2,8

200,1

  • 4,0

Fair value hedging of aircraft acquisitions 445,4 17,5 316,2

  • 17,4

Currency hedging of lease payments 107,4 5,2 131,7

  • 8,6

Hedge accounting items total 1 737,6 35,5 1 228,4

  • 35,5

Hedging of assets held for sale 101,3 3,6 Balance sheet hedging (forward contracts) 131,8 1,7 101,0

  • 0,9

Items outside hedge accounting total 131,8 1,7 202,3 2,6 Currency derivatives total 1 869,4 37,2 1 430,7

  • 32,8

Commodity derivatives Jet fuel forward contracts, tonnes 924 500

  • 74,3

808 000 58,3 Options Bought options, jet fuel, tonnes 169 500 0,7 91 000 4,8 Sold options, jet fuel, tonnes 169 500

  • 11,6

91 000

  • 0,1

Hedge accounting items total

  • 85,2

63,0 Options Sold options, jet fuel, tonnes 146 500

  • 1,1

37 000

  • 0,4

Items outside hedge accounting total

  • 1,1
  • 0,4

Commodity derivatives total

  • 86,4

62,7 Currency and interest rate swaps and options Interest rate swaps 64,9 0,7 Hedge accounting items total 0,0 0,0 64,9 0,7 Cross currency Interest rate swaps 232,7

  • 5,8

239,6

  • 18,5

Items outside hedge accounting total 232,7

  • 5,8

239,6

  • 18,5

Interest rate derivatives total 232,7

  • 5,8

304,5

  • 17,9

Equity derivatives Stock options Bought options 3,0 26,0 Sold options 3,0

  • 14,7

Hedge accounting items total 0,0 0,0 6,0 11,3 Equity derivatives total 0,0 0,0 6,0 11,3 Derivatives total

  • 54,9

23,2 No significant changes have been made to the Group’s risk management principles in the reporting period. The objectives and principles of risk management are consistent with the information presented in the Group’s 2017 financial statements. The tables below present the nominal value or the amount and net fair value of derivative contracts used in Group's hedge accounting. 31 Dec 2018 31 Dec 2017

slide-10
SLIDE 10
  • 6. FINANCIAL ASSETS AND LIABILITIES MEASURED AT FAIR VALUE

Fair value hierarchy of financial assets and liabilities valued at fair value Fair values at the end of the reporting period, in mill. EUR 31 Dec 2018 Level 1 Level 2 Financial assets at fair value through profit and loss Securities held for trading 892,2 836,6 55,5 Derivatives held for trading Currency derivatives 47,7 47,7

  • of which in fair value hedge accounting

18,1 18,1

  • of which in cash flow hedge accounting

27,8 27,8 Commodity derivatives 4,0 4,0

  • of which in cash flow hedge accounting

4,0 4,0 Total 943,8 836,6 107,2 Financial liabilities recognised at fair value through profit and loss Derivatives held for trading Currency and interest rate swaps and options 5,8 5,8 Currency derivatives 10,5 10,5

  • of which in fair value hedge accounting

0,6 0,6

  • of which in cash flow hedge accounting

9,7 9,7 Commodity derivatives 90,9 90,9

  • of which in cash flow hedge accounting

89,7 89,7 Total 107,1 0,0 107,1 During the reporting period no significant transfers took place between fair value hierarchy Levels 1 and 2. The fair values of hierarchy Level 1 are based fully on quoted (unadjusted) prices in active markets of the same assets and liabilities. The fair values of Level 2 instruments are, to a significant extent, based on input data other than the quoted prices included in Level 1, but still mainly based directly observable data (price) or indirectly observable data (derived from price) for the particular asset or liability.

slide-11
SLIDE 11
  • 7. COMPANY ACQUISITIONS AND DIVESTMENTS
  • 8. INCOME TAXES
  • 9. DIVIDEND PER SHARE
  • 10. CHANGE IN INTANGIBLE AND TANGIBLE ASSETS

in mill. EUR 31 Dec 2018 31 Dec 2017 Carrying amount at the beginning of period 1 437,6 1 178,8 Additions 331,0 518,6 Acquisitions through business combinations 0,4 Change in advances 40,7

  • 135,2

Currency hedging of aircraft acquisitions

  • 34,9

92,0 Disposals and reclassifications

  • 76,4
  • 87,8

Depreciation

  • 151,1
  • 129,2

Carrying amount at the end of period 1 547,0 1 437,6 Proportion of assets held for sale at the beginning of period 0,1 139,3 Proportion of assets held for sale at the end of period 0,1 0,1

  • 11. ASSETS HELD FOR SALE

Non-current assets held for sale 31 Dec 2018 31 Dec 2017 Intangible and tangible assets 0,1 0,1 Assets from subsidiary held for sale 16,6 Total 0,1 16,7 Liabilities of non-current assets held for sale 31 Dec 2018 31 Dec 2017 Liabilities from subsidiary held for sale 11,2 Total 0,0 11,2

  • 12. INTEREST-BEARING LIABILITIES
  • 13. CONTINGENT LIABILITIES

in mill. EUR 31 Dec 2018 31 Dec 2017 Guarantees on behalf of group undertakings 82,0 71,0 Guarantees on behalf of others 0,6 Total 82,6 71,0 Investment commitments for property, plant and equipment as at 31 December 2018 totalled 975 million euros (31 December 2017: 1,013). There were no business acquisitions or disposals during three first quarters of the 2018. Finnair announced at the end of August that it will sell 60 per cent of Nordic Regional Airlines AB to Danish Air Transport. The Finnish Competition and Consumer Authority approved the transaction at the end of September, and the transaction was closed in October. The effective tax rate for 2018 was 20.1% (19.8%). The Board of Directors proposes to the Annual General Meeting that a dividend of EUR 0.274 per share be paid for 2018. A dividend for 2017 of 0.30 euro per share, amounting to a total of EUR 38.4 million, was decided in the Annual General Meeting on 20 March

  • 2018. The dividend was paid on 4 April 2018.

A dividend for 2016 of 0.10 euro per share, amounting to a total of EUR 12.8 million, was decided in the Annual General Meeting on 16 March

  • 2017. The dividend was paid on 4 April 2017.

Assets and liabilities held for sale include Finnair's ownership in Nordic Regional Airlines Ab (Norra), which was acquired to Finnair's full

  • wnership on an interim basis during fourth quarter of 2017. Previously Finnair owned 40% share and it was classified as joint venture. Finnair

announced at the end of August that it will sell 60 per cent of Norra to Danish Air Transport. The Finnish Competition and Consumer Authority approved the transaction at the end of September, and the transaction was closed in October. During the last quarter of 2018 Finnair amortized its loans according to the loan instalment programs.

slide-12
SLIDE 12
  • 14. OPERATING LEASE COMMITMENTS

in mill. EUR 31 Dec 2018 31 Dec 2017 Lease commitments for fleet payments 1 213,8 1 163,6 Other lease commitments 243,2 265,8 Total 1 457,1 1 429,4

  • 15. RELATED PARTY TRANSACTIONS

in mill. EUR 2018 2017 Sales of goods and services Associates and joint ventures 44,1 42,2 Pension fund 0,2 0,0 Purchases of goods and services Associates and joint ventures 105,4 105,6 Pension fund 3,0 3,5 Transfers under finance arrangements Associates and joint ventures 2,0 2,0 Receivables Current receivables from associates and joint ventures 9,2 Liabilities Non-current liabilities to joint ventures 3,6 Non-current liabilities to pension fund 16,5 4,1 Current liabilities to associates and joint ventures 2,1

  • 16. EVENTS AFTER THE CLOSING DATE

There has not been any material events after the closing date. Transactions with Finnair's joint venture Nordic Regional Airlines AB Group (Norra) have been included in transactions with joint ventures for the full financial year of 2018. Norra became temporarily a fully-owned subsidiary of Finnair on 17 November 2017, when former partners Staffpoint Holding Oy and Kilco Oy decided to withdraw from the arrangement. Finnair announced at the end of August 2018 that conclusion was reached with new partner Danish Air Transport (DAT) and the transaction was closed at the beginning of October 2018. When the 60% share was sold to DAT, Norra once again became a joint venture of Finnair. Although Norra was a fully-owned subsidiary between 17 November 2017 and 1 October 2018, during that time it was classified as an asset held for sale, and the transactions related to the purchase traffic arrangement between the parties were not eliminated from Finnair's results from continuing operations, as the arrangement was expected to continue after the sale of the 60% share.

slide-13
SLIDE 13
  • 17. CHANGES IN ACCOUNTING PRINCIPLES

IFRS 15 Revenue from Contracts with Customers Effects of the changes in accounting principles in retained earnings 1 Jan 2018 Passenger revenue 2,9 Ancillary and retail revenue

  • 5,3

Travel services

  • 6,2

Revenue related effects total

  • 8,7

Expenses for tour operations 2,8 Income taxes 1,2 Total recognised in retained earnings

  • 4,7

IFRS 2 Share-based Payment Finnair adopted the new standard on revenue recognition in the beginning of 2018. Under IFRS 15, revenue is recognised at an amount that reflects the consideration to which an entity expects to be entitled in exchange for transferring goods or services to a customer. The standard superseded all current revenue recognition requirements under IFRS. Finnair applied cumulative catch-up method in the transition. IFRS 15 changes the timing of revenue recognition mainly in passenger revenue (ticket sales) and ancillary revenue. The changes in recognition are described below and impact is minor. In its interpretation for issues requiring clarity under the new standard, Finnair applies published industry papers prepared by airlines through IATA (International Air Transport Association) Industry Accounting Working Group (IAWG). In passenger revenue, customers usually pay their tickets upfront but do not always exercise their rights and tickets remain unused (breakage). According to IFRS 15, if the airline expects to be entitled to breakage, the airline should recognise the expected breakage amount as revenue in proportion to the pattern of rights exercised by the passenger. Previously ticket revenue was recognised when the tickets were used or when the rights expired. In practice the recognition of breakage means that revenue is recognised earlier but the impact is insignificant. Finnair Plus loyalty program accounting treatment or point valuation did not change due to implementation of IFRS 15. In ancillary sales, the revenue related to change fees is recognised later than previously, since it is considered as a contract modification instead of separate revenue transaction. In travel services, flight and hotel are considered separate performance obligations and are recognised as service is delivered. Previously travel services have been considered as one performance obligation. The impact of the change is minor. In the beginning of 2018, Finnair made an adjustment of -4.7 million euros to its retained earnings related to these changes in these accounting principles. The adjustment consists of decrease in revenue -8.7 million euros, decrease in expenses for tour operations +2.8 million euros and changes in deferred taxes +1.2 million euros. Finnair adopted the amendment to Share-based Payment standard, IFRS 2, at the beginning of 2018. According to the amendment, those share-based payments that are settled net of taxes are considered in its entirety as equity-settled share-based payment transactions. Previously the taxes were considered cash-based payments. All Finnair's performance share plans for key personnel (LTI) and FlyShare employee share savings plans are net-settled. At the beginning of 2018, the carrying value of unexercised cash-settled share-based payments was 3.8 million euros. These were reclassified from liabilities related to employee benefits to equity. Prior periods were not restated.

slide-14
SLIDE 14

IFRS 16 Leases The new leasing standard IFRS 16 will be effective from 2019 onwards. It replaces the previous standard (IAS 17 Leases). Finnair will adopt the standard from 2019 onwards and will apply the full retrospective method to each prior reporting period presented. Finnair has carried out an extensive implementation project and the new standard will have a significant impact on its financial statements and key ratios. The present value of the future operating lease payments for aircraft, real estate and other qualifying operating lease arrangements will be recognised as right-of-use assets with corresponding interest-bearing lease liabilities on the balance sheet. Currently, future lease payments for operating leases are presented in th note as operating lease commitments at their nominal value. The currently reported lease commitments at the end of Q4 2018 amounted to 1,457 million euros (see note 14. Operating lease commitments for more detail). Applying the full retrospective method and using the current interpretations of the relevant elements of the standard as set out below, Finnair estimates that its assets will increase by 1,0 billion euros due to the recognition of right-of-use assets, of which the majority (~80 %) are aircraft. Liabilities will increase in total by 1,1 billion euros due to the recognition of the present value of qualifying operating lease liabilities. The comparative information will be restated, and the cumulative effect of initially applying IFRS 16 is made as an adjustment to opening equity of

  • 2018. The net impact to equity will be 0,1 billion euros. The changes in the amout of equity and liabilities are reflected in the equity ratio, which

Finnair expects to decrease by more than 10 p.p. due to adopting the standard. Impacts to financial statements of 31.12.2018 Interest-bearing net debt will increase by the amount of the present value of qualifying operating lease payments of 1,1 billion euros. This will be reflected in the key figure Gearing %, which will increase significantly (by more than 100 p.p.), to approximately 70 %. Finnair currently discloses a key ratio called ”Adjusted gearing”, which takes operating lease payments into account in the following way: aircraft operating lease costs for the last twelve months are multiplied by 7 and added to the interest-bearing net debt (see Balance sheet: “Additional information to Balance sheet: Interest-bearing net debt and adjusted gearing"). This key figure stood at 67 % at the end of reporting year 2018. When the new standard is in effect, aircraft operating lease payments are no longer recognised in aircraft lease costs. Instead, the net present value of future aircraft lease payments is recognised in interest-bearing debt, which is already included in the calculation of “Gearing”. KPI “Adjusted gearing” will therefore be replaced with “gearing”. The leasing standard will also impact Finnair’s income statement. From 2019 onwards, operating lease expenses will be divided into the depreciation of the right-of-use asset (affecting the comparable operating result) and the interest costs associated with the liability (affecting finance net). The interest costs for the liability are at their highest in the beginning of the lease term, decreasing towards the end of the term as the lease liability is amortised. Currently, operating lease expenses are accrued over the lease term primarily on a straight-line basis and recognised in the operating result as lease payments for aircraft and other rents, according to the lease contract terms. In addition to the impact

  • n operating result and EBITDA, cash flow from operating activities will also increase, as the amortisation of lease liabilities is transferred from
  • perating activities to financing activities in cash flow.

Finnair estimates that its 2018 comparable operating result will improve by approximately 30 % due to adopting the new standard. Depreciation will increase due to depreciation of right of use assets, but the qualifying operating lease payments will no longer be included in

  • perating result and will be instead included in lease liability repayments and financial expenses. Finnair’s net result in 2018 will, however,

decrease by an estimated 30 per cent due to interest expenses and foreign exchange losses associated with USD denominated aircraft lease payments and liability. The majority of the decrease in Finnair’s net result is derived from unrealized foreign exchange losses caused by the translation of the USD denominated liability. The amount of the foreign currency exchange effect could be positive or negative, depending on the USD-rate at the closing date. As at January 2019, Finnair aims to mitigate the foreign exchange volatility introduced by this difference by adjusting its hedging policy. The annual effect in net result going forward is dependent on the size of the qualifying operating lease portfolio and the duration of the leases. In the cash flow statement, repayments of lease liabilities will be moved from operating cash flow to financing cash flow in accordance with IFRS 16. Operating cash flow will increase by approximately 30 %, with a corresponding negative adjustment in financing cash flow. A more detailed description of the standard change is available in Finnair Financial Statements 2018.

slide-15
SLIDE 15
  • 18. CALCULATION OF KEY RATIOS

Alternative performance measures Calculation Reference to reason to use the measure Reference to reconciliation Items affecting comparability Unrealized changes in foreign currencies of fleet overhaul provisions + Fair value changes of derivatives where hedge accounting is not applied + Sales gains and losses on aircraft and other transactions + Restructuring costs Note 1. Basics of preparation, Note 4. Segment information, revenue and items affecting comparability Note 4. Segment information, revenue and items affecting comparability Comparable operating result Operating result - Items affecting comparability Note 1. Basics of preparation Income statement, Note 4. Segment information, revenue and items affecting comparability Comparable EBITDAR Comparable operating result + Depreciation and impairment + Lease payments for aircraft Note 1. Basics of preparation Income statement Adjusted interest-bearing liabilities Interest-bearing liabilities + Cross currency interest rate swaps in derivative financial instruments Component used in calculating gearing and adjusted gearing Additional information to Balance Sheet: Interest- bearing net-debt and adjusted gearing Cash funds Cash and cash equivalents + Other financial assets Component used in calculating gearing and adjusted gearing. Liquid funds represent the total amount of financial assets that are available for use within short notice. Therefore, liquid funds provide the true and fair view of the Group’s financial position. Additional information to Balance Sheet: Interest- bearing net-debt and adjusted gearing, Notes to consolidated cash flow statement Interest-bearing net debt Adjusted interest-bearing liabilities - Cash funds Note 1. Basics of preparation Additional information to Balance Sheet: Interest- bearing net-debt and adjusted gearing Adjusted interest-bearing net debt Interest-bearing net debt + 7 x Lease payments for aircraft for the last twelve months Note 1. Basics of preparation Additional information to Balance Sheet: Interest- bearing net-debt and adjusted gearing Adjusted gearing, % Adjusted interest-bearing net debt / Equity x 100 Note 1. Basics of preparation Additional information to Balance Sheet: Interest- bearing net-debt and adjusted gearing

slide-16
SLIDE 16

Other key ratios - Revenue and profitability Earnings per share (EPS) Unit revenue per available seat kilometre (RASK) Unit revenue per revenue passenger kilometre (yield) Unit cost per available seat kilometre (CASK) EBITDA Other key ratios - Capital structure Equity ratio, % Gearing, % Gross capital expenditure Return on capital employed (ROCE) Other key ratios - Growth and traffic Available seat kilometres (ASK) Revenue passenger kilometres (RPK) Passenger load factor (PLF) The figures of the Financial Statements Bulletin are unaudited. Share of revenue passenger kilometres of available seat kilometres (Result for the period - Hybrid bond expenses net of tax) / Average number of outstanding shares during the period Unit revenue (RASK) represents the Group's revenue divided by available seat kilometres (ASK). Unit revenue (RASK) with constant currency aims to provide a comparative, currency neutral measurement for unit revenues. All the currency changes and currency hedging results are excluded from the measurement. Passenger Revenue by product divided by Revenue passenger kilometres (RPK). Unit cost (CASK) represents the Group's operational costs divided by available seat kilometres. Other

  • perating income is deducted from operational costs.

Unit cost (CASK) with constant currency aims to provide a comparative, currency neutral measurement for unit costs. All the currency changes and currency hedging results are excluded from the measurement. Operating result + Depreciation and impairment Equity + Equity and liabilities total x 100 Interest-bearing net debt / Equity x 100 Investments in intangible and tangible assets excluding advance payments (Result before taxes + Financial expenses) / (Equity + Interest-bearing liabilities, average of reporting period and comparison period) Total number of seats available × kilometres flown Number of revenue passengers × kilometres flown