
SLIDE 1
Q2 2018 Investor Presentation ForwardLooking Statements This - - PowerPoint PPT Presentation
Q2 2018 Investor Presentation ForwardLooking Statements This presentation contains "forward-looking information" as defined under Canadian securities laws which reflect managements expectations regarding objectives, plans,
This presentation contains "forward-looking information" as defined under Canadian securities laws which reflect management’s expectations regarding objectives, plans, goals, strategies, future growth, results of operations, performance, business prospects and opportunities of WPT Industrial Real Estate Investment Trust (the “REIT"), including statements concerning the Transaction (as defined herein) providing access to additional capital resources and enhanced and diversified cash flows, achievement of the targeted US$1.0 B in equity for the venture with Canada Pension Plan Investment Board and Alberta Investment Management Corporation (the “Venture”), achievement of increased property acquisition through the Venture pipeline, expected private capital management and incentive fees, expected availability of WPT Capital Advisors, LLC-managed properties for acquisition and the length of employment for the internalized employees. The words “plans”, “expects”, “scheduled”, “estimates”, “intends”, “anticipates”, “projects”, “believes”, or variations of such words and phrases (including negative variations) or statements to the effect that certain actions, events or results “may”, “will”, “could”, “would”, “might”, “be achieved”, or “continue” and similar expressions identify forward-looking statements. These statements reflect the REIT's current expectations regarding future events and operating performance, the REIT’s future growth potential and other prospects and opportunities, results of operations, demographic and industry trends and future legislative and regulatory approaches with respect to matters affecting the REIT and speak only as of the date of this presentation. Forward looking statements are necessarily based on a number of estimates, beliefs and assumptions that are inherently subject to significant business, economic and competitive uncertainties and contingencies which could cause actual results to differ materially from those that are disclosed in such forward-looking statements. While considered reasonable by management of the REIT as of the date of this presentation, any of these estimates, beliefs
statements to make decisions, the REIT cautions readers not to place undue reliance on these statements, as forward-looking statements involve significant risks and uncertainties and should not be read as guarantees of future performance or results, and will not necessarily be accurate indications of whether or not the times at or by which such performance or results will be achieved, if achieved at all. A number of factors could cause actual results to differ materially from the results discussed in the forward-looking statements, including but not limited to those factors discussed or referenced under the “Risk Factors” section of the REIT’s MD&A and the REIT’s annual information form (the “AIF”) for the year ended December 31, 2017. This presentation does not constitute or form part of any offer for sale or solicitation of any offer to buy or subscribe for any securities nor shall it or any part of it form the basis of or be relied on in connection with, or act as any inducement to enter into, any contract or commitment whatsoever. The information contained in this presentation concerning the REIT and its affiliates does not purport to be all-inclusive or to contain all the information that a prospective purchaser or investor may desire to have in evaluating whether or not to make an investment in the REIT. The information is qualified entirely by reference to the REIT’s MD&A and the AIF. The term debt-to-gross book value (“GBV”) included in this presentation is used by management to measure, compare and explain the operating results and financial performance of the REIT and is not recognized terms under IFRS. Management believes this term is a relevant measures in comparing the REIT’s performance to industry data, the REIT’s ability to earn and distribute cash returns to holders of the REIT’s trust units, and the REIT’s ability to meet its ongoing obligations. This term does not have a standardized meaning prescribed by IFRS and may not be comparable to a similarly titled measure presented by other issuers.
2
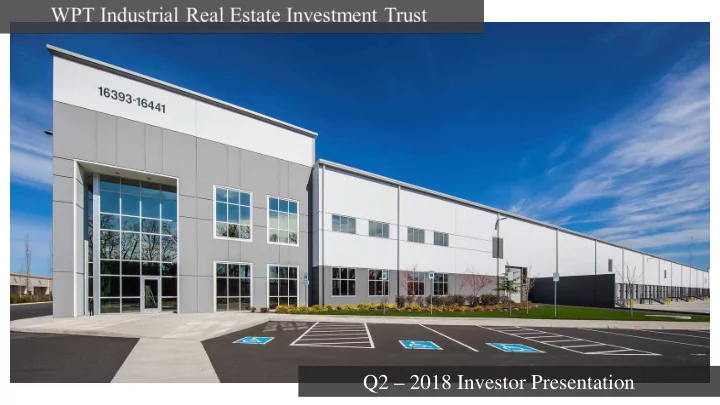
WPT Industrial Real Estate Investment Trust is the only Canadian-listed REIT focused exclusively on the U.S. Industrial Sector
4
Seasoned management team with extensive knowledge of the U.S. industrial sector Access to high-barrier U.S. markets through off-market private capital acquisition pipeline Unit price and annual distribution of $0.76/unit in U.S. Dollars
5
OFF-MARKET INVESTMENT PIPELINE FEE REVENUE FROM THIRD- PARTY CAPITAL
EXTERNAL GROWTH
EXTENSIVE INDUSTRY RELATIONSHIPS
PARTNERSHIPS WITH PREMIER GLOBAL INVESTORS
ENTRY INTO NEW U.S. MARKETS STRATEGIC FINANCING CONTRACTUAL RENT INCREASES MAINTAINING CONSISTENTLY HIGH OCCUPANCY
INTERNAL GROWTH
ROLLING RENTS TO MARKET AT RENEWAL PROPERTY EXPANSION AND DEVELOPMENT
WPT MANAGEMENT PLATFORM
6
………………………………
…………………………………
……………………………………….
INVESTMENT PROPERTIES
………………………………
TOTAL SQUARE FEET OF GLA
…………………………………
FAIR VALUE OF INVESTMENT PROPERTIES
1. As at June 30, 2018 2. Industrial assets only
1
7
1. As at June 30, 2018
/ Washington D.C
Tenant
Industry % of Total Annualized Base Rent1 GLA Occupied (‘000s sq. ft.)1 (%) of Total Portfolio GLA1
General Mills Operations, LLC Consumer Products 5.6% 1,512.6 8.4% Continental Tire the Americas Consumer Products 5.0% 740.9 4.1% Unilever Home & Personal Care Consumer Products 4.9% 1,262.6 7.0% Zulily, LLC E-Commerce 3.7% 737.5 4.1% Keystone Automotive2 Consumer Products 3.6% 633.6 3.5% Fullbeauty Brands, Inc. E-Commerce 3.0% 741.1 4.1% Radial, Inc. E-Commerce 2.8% 543.5 3.0% CEVA Logistics U.S. Inc. Third Party Logistics 2.8% 648.8 3.6% Amazon.com E-Commerce 2.7% 572.0 3.2% Honeywell International Inc. Consumer Products 2.7% 754.0 4.2% Total 36.8% 8,146.6 45.2%
8
1. As at June 30, 2018 2. Comprised of two leases with Keystone Automotive Operations, Inc. and Keystone Automotive Industries, Inc.; both wholly-owned subsidiaries of LKQ Corporation.
1
2
2
9
1. As at June 30, 2018 2. Excludes the REIT’s credit facility
10
1
1. As at June 30, 2018 and excludes the REIT’s credit facility
4.5% 3.4% 3.1% 4.6% 3.8% 3.7% 3.5% Weighted Average Interest Rate of Maturities
Weighted average interest rate
32.1 32.1 87.7 73.7 26.4 53.2 41.0
20.0 30.0 40.0 50.0 60.0 70.0 80.0 90.0 100.0 2018 2019 2020 2021 2022 2023 2024
Maturities ($ in Millions)
Debt Maturities by Year
Weighted average remaining lease term
11
1. As at June 30, 2018 2. Includes one month-to-month lease
92 20 14 27 23 14 6 13 Number of Leases Expiring
6.0% 11.9% 16.5% 16.9% 19.7% 12.8% 4.9% 11.3%
2018 2019 2020 2021 2022 2023 2024 2025+
Lease Expiration (% of GLA) by Year ¹
1
As at 6/30/2017, the REIT had 4 leases totaling 2.1% of the portfolio remaining to be renewed.
12
1. As at June 30, 2018 2. Includes one month-to-month lease
9 leases
2 totaling 6.0% of the portfolio expiring in 2018, including:
20 leases totaling 11.9% of the portfolio expiring in 2019, including:
Significant lease renewals completed as at June 30, 2018:
1
13
195.5 252.5 154.0 129.6 70 90 110 130 150 170 190 210 230 250 Mar-13 Jun-13 S ep-13 Dec-13 Mar-14 Jun-14 S ep-14 Dec-14 Mar-15 Jun-15 S ep-15 Dec-15 Mar-16 Jun-16 S ep-16 Dec-16 Mar-17 Jun-17 S ep-17 Dec-17 Mar-18 Jun-18 WIR (US $) WIR (CAD$) S &P/ TS X Composite Index (CAD$) S &P/ TS X Capped REIT Index (CAD$)
│ 14
Recently announced transactions include:
(“Transaction”)); and
(“AIMCo”)
Additional capital resources through a private capital business with established AUM/institutional partnerships
✔
Immediate access to a pipeline of 4.0M sq. ft. of modern industrial assets across the U.S., including high-barrier markets
✔
Fully-internalized management platform brought into the REIT under a single, transparent and simplified structure
✔
Transaction Highlights New venture with CPPIB/AIMCo targeting up to US$1.0B of combined equity, creating a proprietary acquisition pipeline
✔
Enhanced and diversified cash flows through management and incentive fees on third-party capital
✔
Increased long-term alignment between REIT management, public unitholders, and private capital partners
✔
Expanded Pipeline and Footprint
investors CPPIB and AIMCo
properties in strategic markets, including high-barrier coastal markets
REIT’s portfolio Increased Alignment of Interests
paid in equity (with long-term transfer restrictions) increasing management’s effective ownership in the REIT
promote long-term alignment between management, public unitholders and private capital partners Creates Value Through Growing Private Capital Business
substantial embedded private capital business
deploy financial resources more efficiently and pursue larger portfolio transactions with varied risk/return profiles
The Transaction creates a fully-integrated and aligned platform with enhanced capital resources, primed for growth
Reflects Investor Preference for Internalized REIT Structures
Fully-Internalized Management Platform Under a Single, Transparent and Simplified Structure
real estate
experience and an average firm tenure of 12 years
across the entire risk/return spectrum
non-compete agreements providing continuity of
a competitive market for industrial executives
Benefits of the Acquisition Benefits of the Internalization ✔ ✔ ✔ ✔ ✔
16
17
270 Bridgepoint Drive 13201 Wilfred Lane
18
Location:
MSA: Minneapolis/St. Paul Acquired: June 2018 Purchase Price: $8.3mm Square Feet: 124,800 Land Size(Acres): 10.72 Expandable Area: 75,000sf Clear Height: 24’ Occupancy: 100%
19
Location: Rogers, MN MSA: Minneapolis/St. Paul Acquired: June 2018 Purchase Price: $20.4mm Square Feet: 335,400 Land Size(Acres): 24.34 Expandable Area: 141,000sf Clear Height: 32’ Occupancy: 100%
Source: Cushman & Wakefield Research – Q2 2018
21
Source: CBRE Q2 2018 US Industrial & Logistics Figures
22
Market Indicators
Source: Cushman & Wakefield Research
“As top logistics markets continue to operate at a sub-3.0 percent vacancy rate, we expect continued competition for quality space and added pressure on rents through 2018.” Market Indicators
Source: Cushman & Wakefield Q2 2018 U.S. Industrial Marketbeat report
Overall Vacancy 5.3% 5.0% Net Absorption 61.2mm 64.1mm Under Construction 232.9mm 267.2mm Weighted Asking Rent (NNN) $5.70 $6.11
Vacancy Drops to Record Low Despite Robust Development
U.S. Research Report | Q1 2018 | Industrial Market Outlook | Colliers International
23
“The national industrial vacancy remained at an all-time low at 5.1% for the second consecutive quarter despite nearly 53 million square feet of new supply completing in the first quarter of 2018.”
Source: JLL Q2 2018 Industrial First Look Source: CBRE 2018 U.S. Real Estate Market Outlook
Q2 17 Q2 18
24 0.0 0.5 1.0 1.5 2.0 2.5 3.0 3.5 4.0 4.5 2015 2016 2017 2018E 2019E 2020E
E-Commerce Sales, Global
($, Trillions)
e-commerce companies expanding their footprints in markets where they already had a presence. In comparison, in 2016 e-commerce had 14.7% of the total U.S. leasing market share
get products to consumers quickly while minimizing supply chain costs are forcing retailers and wholesalers into more facilities and rapidly changing supply chain strategy. These changes will be a major contributor to industrial real estate demand for the foreseeable future.
from the same period in 2017 compared to a total retail sales increase of 5.3%.
(Source: JLL Research Report: First Look at Industrial, Q3 2017) (Source: Colliers Research Report: Industrial Market Outlook, Q1 2018) (Source: Q1 2018 US Census Bureau’s ‘Quarterly Retail E-Commerce Sales)
Name Firm Email Phone
Troy MacLean, CFA BMO Capital Markets troy.maclean@bmo.com (416) 359-8366 Mark Rothschild Canaccord Genuity Corp mrothschild@canaccordgenuity.com (416) 869-7280 Dean Wilkinson, CFA CIBC dean.wilkinson@cibc.com (416) 594-7194 Michael Markidis, CFA Desjardins Capital Markets michael.markidis@desjardins.com (416) 607-3028 Himanshu Gupta, CA, CFA GMP Securities hgupta@gmpsecurities.com (416) 941-6732 Brad Sturges, CFA iA Securities bsturges@iagto.ca (416) 203-5827 Matt Kornack National Bank Financial matt.kornack@nbc.ca (416) 507-8104 Neil Downey, CFA, CA, CPA RBC Capital Markets neil.downey@rbccm.com (416) 842-7835 Pammi Bir, CPA, CA, CFA Scotia Capital pammi.bir@scotiabank.com (416) 863-7218
25
Trustee Real Estate/Board Experience Independent Trustee Audit Committee Investment Committee CG&N1 Committee
Milo Arkema
Louie DiNunzio
Scott Frederiksen
Chair of the Board
Trust, LLC
Sarah Kavanagh
Stuart H.B. Smith
Pamela Spackman
Province of British Columbia
Robert Wolf
Lead Trustee
(CHAIR) (CHAIR) (CHAIR)
26
Scott Frederiksen
Chief Executive Officer P: 612-800-8501 E: stf@wptreit.com