
SLIDE 1
1
JOHAN DENNELIND PRESIDENT & CEO
INTERIM REPORT JANUARY – MARCH 2018
Q1
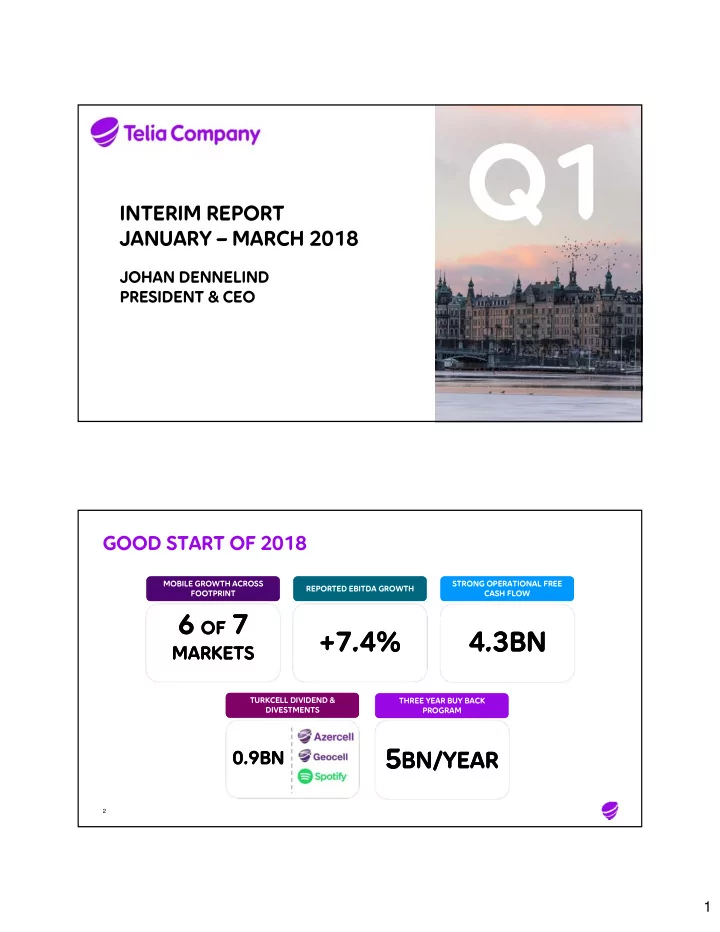
GOOD START OF 2018
2 MOBILE GROWTH ACROSS FOOTPRINT MOBILE GROWTH ACROSS FOOTPRINT TURKCELL DIVIDEND & DIVESTMENTS TURKCELL DIVIDEND & DIVESTMENTS THREE YEAR BUY BACK PROGRAM THREE YEAR BUY BACK PROGRAM STRONG OPERATIONAL FREE CASH FLOW STRONG OPERATIONAL FREE CASH FLOW6 OF 7
MARKETS
6 OF 7
MARKETS
5BN/YEAR 5BN/YEAR
0.9BN 0.9BN
4.3BN 4.3BN
REPORTED EBITDA GROWTH REPORTED EBITDA GROWTH+7.4% +7.4%