
SLIDE 1
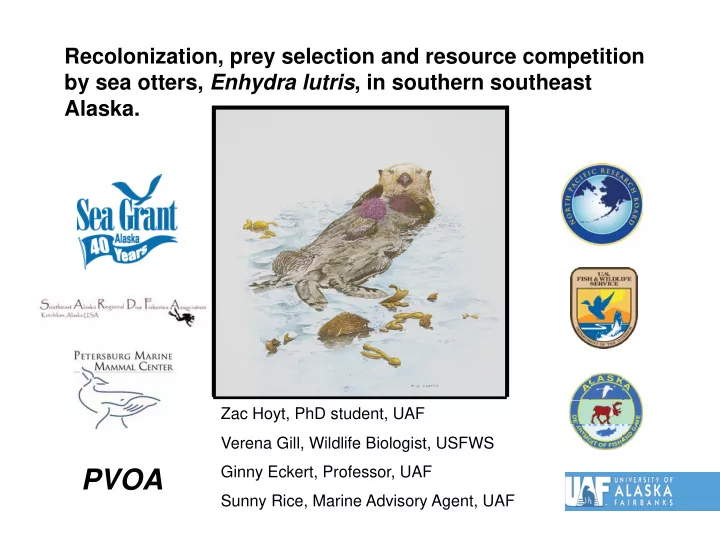
Recolonization, prey selection and resource competition by sea otters, Enhydra lutris, in southern southeast Alaska.
Zac Hoyt, PhD student, UAF Verena Gill, Wildlife Biologist, USFWS Ginny Eckert, Professor, UAF Sunny Rice, Marine Advisory Agent, UAF