purpose and outline demographics
play

Purpose and Outline Demographics demographics ( dm' - grf ' ks ) - PDF document

Introduction: Who is this presenter? Terrance (Terry) J. Bogyo (BSc, MBA, CCRC, RRP) Independent Researcher | Speaker | Consultant 1665 58 A Street Delta, BC V4L 1X5 AASCIF Convention 2015: e-mail: Terry.Bogyo@gmail.com Bridging the


  1. Introduction: Who is this presenter? Terrance (Terry) J. Bogyo (BSc, MBA, CCRC, RRP) Independent Researcher | Speaker | Consultant 1665 58 A Street Delta, BC V4L 1X5 AASCIF Convention 2015: e-mail: Terry.Bogyo@gmail.com Bridging the Future Blog: www.WorkersCompPerspectives.wordpress.com San Francisco July 6 Phone: (604) 943-3545 Terrance J. Bogyo Skype: terry.bogyo Independent Researcher | Speaker | Consultant Canada and California are not so very different 
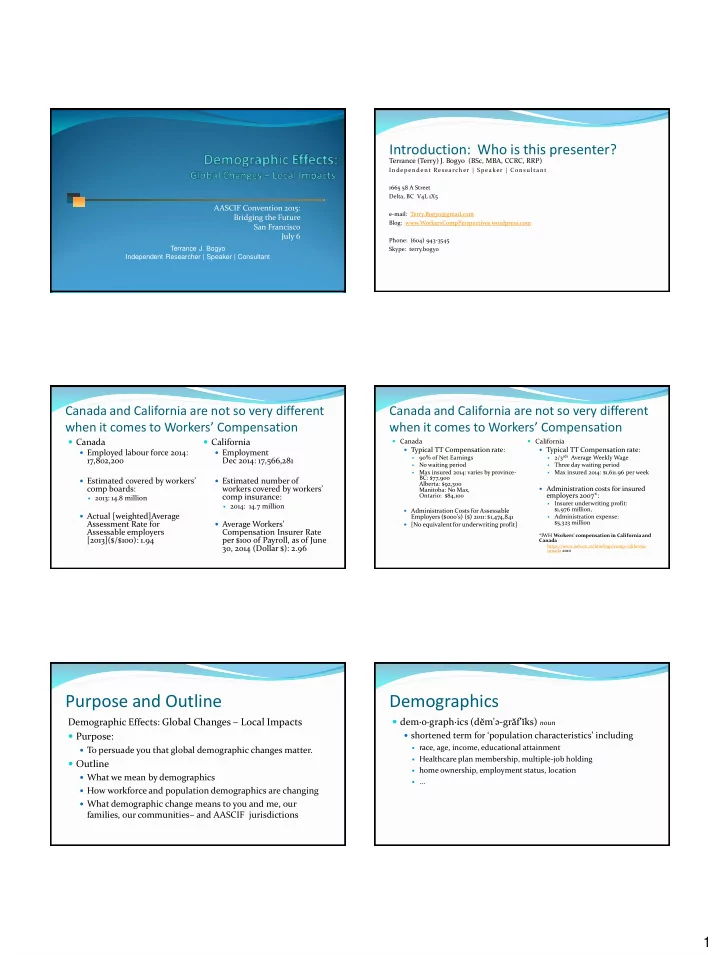
Canada and California are not so very different when it comes to Workers’ Compensation when it comes to Workers’ Compensation  Canada  California  Canada  California  Typical TT Compensation rate:  Typical TT Compensation rate:  Employed labour force 2014:  Employment 2/3 rds Average Weekly Wage  90% of Net Earnings  17,802,200 Dec 2014: 17,566,281 No waiting period Three day waiting period   Max insured 2014: varies by province- Max insured 2014: $1,611.96 per week   BC: $77,900  Estimated covered by workers’  Estimated number of Alberta: $92,300 comp boards: workers covered by workers’  Administration costs for insured Manitoba: No Max, comp insurance: Ontario: $84,100 employers 2007*:  2013: 14.8 million Insurer underwriting profit:   2014: 14.7 million $1,976 million,  Administration Costs for Assessable  Actual [weighted]Average Employers ($000's) ($) 2011: $1,474,841 Administration expense:  Assessment Rate for  Average Workers’ $5,323 million  [No equivalent for underwriting profit] Assessable employers Compensation Insurer Rate *IWH Workers' compensation in California and [2013]($/$100): 1.94 per $100 of Payroll, as of June Canada 30, 2014 (Dollar $): 2.96 https://www.iwh.on.ca/briefings/comp-california- canada 2010 Purpose and Outline Demographics  dem·o·graph·ics ( dĕm' ə - grăf ' ĭks ) noun Demographic Effects: Global Changes – Local Impacts  Purpose:  shortened term for ‘population characteristics’ including  race, age, income, educational attainment  To persuade you that global demographic changes matter.  Healthcare plan membership, multiple-job holding  Outline  home ownership, employment status, location  What we mean by demographics  ...  How workforce and population demographics are changing  What demographic change means to you and me, our families, our communities – and AASCIF jurisdictions 1

  2. Top 10 Countries by Population Rise and Fall of Top Economies by 2050 1,600,000,000 2015  Philippines will advance 27 places to  HSBC 2050 list of top economies 1,400,000,000 2025 16th largest economy. (change in rank from 2010) 2035 1,200,000,000  Japan’s working population will contract by a 37% 1,000,000,000 6) UK (-1) 1) China (+2)  Advanced economies in Europe 800,000,000 7) Brazil (+2) 2) U.S. (-1) will see working population 600,000,000 3) India (+5) 8) Mexico (+5) dwindle 400,000,000 4) Japan (-2)  Biggest drop will be felt 9) France (-3) northern Europe: 200,000,000 5) Germany (-1) 10) Canada (same) Denmark to 56th ( -29),  0  Norway to 48th ( -22), 16) Philippines (+27) Sweden to 38th (-20)  Finland to 57th (-19).  January 12th, 2012 “World’s top economies in 2050 will be ...” Posted by: CNN.com business producer, Kevin Voigt http://sasweb.ssd.census.gov/idb/ranks.html http://business.blogs.cnn.com/2012/01/12/worlds-top-economies-in-2050-will-be/ 10 Viewed May 21, 2015 Population Changes in the US Top 10 Countries by Population speaking…  By 2050, out of every 10: Spanish English Country Country  5 Americans will be white Speakers Speakers  3 Hispanic United States 251,388,301 Mexico 109,955,400  1 Black Colombia 45,013,674 India 125,226,449  1 Asian Philippines 89,800,000 United States 44,321,038 Jeffrey S. Passel and D’Vera Cohn, US Population  Projections, 2005-2050, Pew Research Center February 11, 2008 Nigeria 79,000,000 Argentina 40,677,348  “I t is estimated that by 2050 the United States will be home United Kingdom 59,600,000 Spain 40,491,051 to more 130 million Hispanics, Germany 46,272,504 Peru 29,180,899 making it the largest Spanish- Canada 25,246,220 Venezuela 26,414,815 speaking nation on the planet. ”  Peter Reuell , “Watching Spanish grow: FAS -based France 23,000,000 Chile 16,454,143 observatory to be a center for language study” , Harvard Gazette, June 26, 2013 Australia 17,357,833 Ecuador 13,927,650 Italy 17,000,000 Guatemala 13,002,206 http://pewhispanic.org/files/reports/85.pdf Source: www.Mapsofworld.com 2013 data America’s Hinge Average Employment Income by Age Group & Education Level Moment $90,000  Presidential politics in $80,000 2016 will reflect the $70,000 shifting reality of $60,000 Less than high school America $50,000 High school $40,000  1980 – 80% US Trades College population was white $30,000 University  2060 - <44% $20,000 $10,000 $0 20 to 25 to 30 to 35 to 40 to 45 to 50 to 55 to 60 to Politico Magazine – Mar 29, 2015: America’s Hinge 24 29 34 39 44 49 54 59 64 Moment by Doug Sosnik (democratic strategist, former advisor to Pres. Bill Clinton) Source: Statistics Canada, 2006 Census of Population. Note: data is 2005 dollars 2

  3. Unemployment and Weekly Earnings by Demographic Occupations with higher than average projected of “Educational Attainment” – US 2012 growth rates 2012-22 Unemployment rate in 2012 Median weekly earnings (Percent) ($) Professional degree Doctoral degree Master's degree Bachelor's degree Associate's degree Some college, no degree High school diploma Less than a high school diploma BLS: US Future Job Outlook 13.0 11.0 9.0 7.0 5.0 3.0 1.0 0 500 1000 1500 http://www.census.gov/newsroom/cspan/emplo yment_projections/20140131_employment_proj ections_slides.pdf Demographics of Multiple Job Holders Half of North American WC Jurisdictions (Concurrent Employment) don’t cover Temporary Total Disability loss on Concurrent jobs  Multiple Jobholding Sex and occupation Multiple jobholding rate (percent)  Most generous cover losses in all  AASCIF Men multiple jobs for Total Temp  5-6% of the employed  Firefighters................................................. 28.6  Good news for multiple Disability including uninsured  Emergency medical technicians &paramedics...20.1 labour force job holders. and self-employment  Secondary school teachers......................... 14.0  Ranges up to nearly 10%  Prevalence of multiple job   (Ohio, WorkSafeBC) Social workers............................................. 13.5 holding is higher than  In some occupations, nearly  Elementary and middle school teachers....... 11.5  Some restrict coverage national averages in AASCIF 30%  Similar Employment (Oklahoma) states Women  Highest among women,  Concurrent employment known  Dental hygienists........................................ 12.9  Most member jurisdictions young adults(20-24) Psychologists.............................................. 12.5 to accident employer (Kentucky) (Canada and the US) cover  Postsecondary teachers............................... 11.9  IRS Reported Income (Texas, ND) concurrent employment for  Physical therapists...................................... 11.7  WC covered employment TTD fully or with some  Therapists, all other..................................... 11.5 (WorkSafeNB, Kentucky ) restrictions Demographic: SSDI Recipients Demographic: SSDI Recipients • California • California  H as 8% of the nation’s  H as 8% of the nation’s SSDIrecipients (2012) US SS Disability Insurance Recipients at year end: SSDI recipients (2012) 1999 4,879,455  That’s 3.1% of the state  That’s 3.1% of the state 2013 8,942,584 resident population resident population aged 18 to 64 (4.7% aged 18 to 64 (4.7% Monthly Expenditure as of January 2014 nationally) nationally) (disabled workers only) $10.236 Billion  (762,133 recipients  (762,133 recipients Social Security benefits, January 2014 Quick Facts Table 2 Dec 2012) http://www.ssa.gov/policy/docs/quickfacts/stat_snapshot/ Dec 2012)  Most common causes  Most common causes  Mental disorders 305,382  Mental disorders 305.382 That’s about $ 123B per year.  (“mood disorders” 127,452)  (“mood disorders” 127,452) About a third of all countries  Musculoskeletal 214,719  Musculoskeletal 214,719 on earth have a GDP less than that value. 3

Recommend


More recommend