
SLIDE 1
Public ublic Sa Safety ty Agr Agreem eemen ents ts Alameda Fire - - PowerPoint PPT Presentation
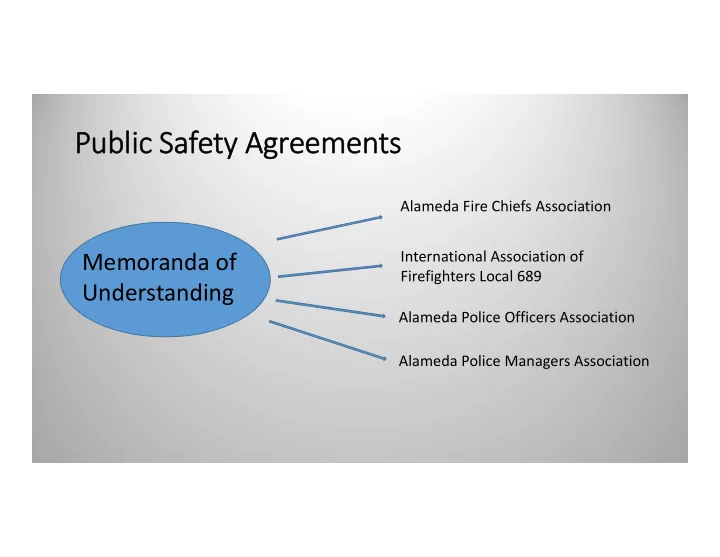
Public ublic Sa Safety ty Agr Agreem eemen ents ts Alameda Fire Chiefs Association International Association of Memoranda of Firefighters Local 689 Understanding Alameda Police Officers Association Alameda Police Managers Association WHA WHAT
Pay‐Go Savings Safety Pay‐Go Safety Pay‐Go with OPEB pick up
1 Those employee hired after June 2011 must contribute an additional 2% of pay to a Supplemental Retirement/Health Plan
Fiscal Year Min BRI Max BRI % Amount % Amount 15‐16 2% $ 400,000 5% $ 1,000,000 16‐17 2% 2,000,000 5% 2,700,000 17‐18 2% 1,300,000 5% 2,500,000 18‐19 0% 650,000 0% 700,000 19‐20 3% 1,900,000 5% 2,900,000
Compounded rate 11.49% 27.63%
Sal/Ben increase
$6,250,000 $9,800,000 Increase in Revenues $4,934,660 $27,960,384 Net $ (1,315,340) $ 18,160,384
Agency PERS OPEB/SUPP PLAN 1 Raises Fremont 9% 0% Under Negotiation Berkeley 9% 0% Under Negotiation Alameda County 14.72% 0% Salary Survey (but no more than 5%) Livermore 9% 1% 2% Pleasanton 10.5% 0% 3%, 3% Hayward 15% 1% 3%,3%,0, Survey (5%) Alameda 15% 4% 2-5%, 2-5%, 2-5%, 0, 3-5%, 2-5%
1 Those employee hired after June 2011 must contribute an additional 2% of pay to a Supplemental Retirement/Health Plan
Agency PERS OPEB/SUPP PLAN1 Raises Fremont 12% 0% Under Negotiation Berkeley 10% 0% Under Negotiation Alameda County 10% 1.355% Salary Survey (but no more than 5%) Livermore/Pleasanton 12% 0% 2% Hayward 15% 1% 3%,3%,0, 5% Alameda 15% 4% 2-5%, 2-5%, 2-5%, 0, 3-5%, 2-5%
1 Those employee hired after June 2011 must contribute an additional 2% of pay to a Supplemental Retirement/Health Plan
YEAR APOA/IAFF YEAR APOA/IAFF 2000 4% 2009 0% 2001 11% (incremental) 2010 0% 2002 4% 2011 0% 2003 3% 2012 0% 2004 4.5% 2013 0% 2005 4% 2014 1.8% (BRI) 2006 5% 2015 4.1% (BRI) 2007 2.5% 2016 2-5% (BRI) 2008 0%
Average = 2.7%/year
CITIES SPECIAL DISTRICTS Alameda Redding Calaveras County Water District Rowland Water District Allen Rialto California JPIA Santa Barbara County Law Library Atherton Richmond Central Contra Costa Sanitary District South Montebello Irrigation District Bakersfield Rosemead Central Contra Costa Transit Authority South Orange County Wastewater Authority Brisbane San Leandro Coachella Valley Water District South Placer Fire Protection District Camarillo Santa Clara Coastside Fire Protection District Southern Marin Fire Protection District Carver Santa Clarita Contra Costa Mosquito & Vector Control District Superior Court of CA, County of Contra Costa Commerce Sausalito – pension too Crestline Village Water District Superior Court of CA, County of Imperial Conroe Southlake Delta Diablo Superior Court of CA, County of Inyo Coppell Temple City Desert Recreation District Superior Court of CA, County of Kern Coronado Tyler Eastern Sierra Community Services District Superior Court of CA, County of Marin Covina Union City Fresno Irrigation District Superior Court of CA, County of Merced Crescent City Wareham Fresno Metropolitan Flood Control District Superior Court of CA, County of Orange Cupertino Woodland Glenn‐Colusa Irrigation District Superior Court of CA, County of San Mateo Duarte Yountville Great Basin Unified Air Pollution Control District Superior Court of CA, County of Shasta Elk Grove Yucca Valley Hayward Area Recreation & Park District Superior Court of CA, County of Siskiyou Euless Housing Authority of Florence, SC Superior Court of CA, County of Sonoma Fort Worth Housing Authority of the County of San Bernardino Tarrant Regional Water District Fountain Valley COUNTIES INTELECOM Vallejo Sanitation & Flood Control District Galt Amador Menlo Park Fire Protection District Ventura Regional Sanitation District Garland Contra Costa Mesa Water District Walnut Valley Water District Half Moon Bay Imperial MetropolitanTransportationCommission West County Wastewater District Haltom City Inyo Mid‐Peninsula Water District Western Riverside Council of Governments Hercules Kern Mojave Desert Air Quality Management District SCHOOL DISTRICTS Hermosa Beach Merced Montecito Fire Protection District Bass Lake Joint UESD Ontario‐MontclairSD Hurst Mono Monterey Bay Unified Air Pollution Control District Bellflower USD Red Bluff Joint ESD La Verne Plumas Moraga‐Orinda Fire Protection District Calistoga Joint USD Red Bluff Joint UHSD Lake Forest Plymouth Municipal Water District of Orange County Centinela Valley UHSD River Delta USD Lakewood San Benito Northern Lancaster County Reg Police Department Corning Union ESD Riverdale Joint USD Livermore Shasta Orange County Vector Control District El Dorado UHSD San Bruno Park SD Mammoth Lakes Solano – pension too Orange County Water District Fowler USD San Marino USD Mansfield Sonoma Placer County Resource Conservation District John Swett USD Trona JUSD North Richland Hills Trinity Rancho Murrieta Community Services District Lemon Grove SD Twin Rivers USD Norwalk Yolo Manteca USD Visalia USD Novato COMMUNITY COLLEGE DISTRICTS Moreno Valley USD State Center CCD Yosemite CCD Last Updated: April 2015
1 Partial List – Includes PARS Clients Only
Ending Available Fund Balance assumes no cost-saving measures are taken after 15-16. 5‐Year Forecast for FY 15‐16 through FY 19‐20 (in millions)
15‐16 16‐17 17‐18 18‐19 19‐20
Beginning Fund Balance
29.6 $ 30.9 $ 29.9 $ 27.2 $ 23.2 $
Revenues
81.4 81.6 82.8 84.0 85.2
Transfers In
0.5 0.5 0.5 0.5 0.5
Expenditures & Transfers Out
(80.5) (83.1) (85.9) (88.4) (91.0)
Annual Operating Results
1.3 (1.1) (2.7) (4.0) (5.3)
Ending Fund Balance
30.9 $ 29.9 $ 27.2 $ 23.2 $ 17.9 $
% of annual expenditures and transfers out
38% 36% 32% 26% 20%
15‐16 16‐17 17‐18 18‐19 19‐20
Beginning Fund Balance
29.6 $ 30.8 $ 29.3 $ 26.3 $ 22.0 $
Revenues
81.4 81.6 82.8 84.0 85.2
Transfers In
0.5 0.5 0.5 0.5 0.5
Expenditures & Transfers Out
(80.7) (83.5) (86.3) (88.8) (91.1)
Annual Operating Results
1.2 (1.4) (3.1) (4.3) (5.4)
Ending Fund Balance
30.8 $ 29.3 $ 26.3 $ 22.0 $ 16.5 $
% of annual expenditures and transfers out
38% 35% 30% 25% 18%
FY14/15 FY15/16 FY16/17 FY17/18 FY18/19 FY19/20 % Increase
$ 57.5 $ 58.2 $ 59.4 $ 60.4 $ 61.5 $ 62.4 5% 1% 2% 2% 2% 1% 14% 2.5% 2% 2% 2% 2% 2% 12.5% FY14/15 FY15/16 FY16/17 FY17/18 FY18/19 FY19/20 % Increase
$ 57.5 $ 63.2 $ 69.5 $ 70.6 $ 77.7 $ 85.4 5% 10% 10% 2% 10% 10% 47% 2.5% 5% 5% 2% 5% 5% 24.5%
RAISES*
RAISES*
½ BRI
* Raises are effective January 1 following the Fiscal Year in which BRI is calculated
½ BRI
Years OPEB Pay-Go No Contract OPEB Pay-Go With Contracts FY 2016-2020 17,273,000 16,832,000 FY 2021-2025 24,595,000 18,499,000 FY 2026-2030 30,882,000 17,390,000 FY 2031-2035 34,962,000 18,048,000 FY 2036-2040 37,498,000 32,613,000 FY 2041-2045 43,107,000 37,609,000 TOTAL $188,317,000 $140,991,000
TOTAL SAVINGS $47,326,000*