PTCL-NOS: Gene expression profiling
T-cell Lymphomas: we are close to the finalization”
Javeed Iqbal Department of Pathology and Microbiology James O. Armitage center for Leukemia and Lymphoma Research University of Nebraska Medical Center Omaha,NE
PTCL-NOS: Gene expression profiling Javeed Iqbal Department of - - PowerPoint PPT Presentation
PTCL-NOS: Gene expression profiling Javeed Iqbal Department of Pathology and Microbiology James O. Armitage center for Leukemia and Lymphoma Research University of Nebraska Medical Center Omaha,NE T- cell Lymphomas: we are close to the
T-cell Lymphomas: we are close to the finalization”
Javeed Iqbal Department of Pathology and Microbiology James O. Armitage center for Leukemia and Lymphoma Research University of Nebraska Medical Center Omaha,NE
1956 1974 1982 1988 1998 2001
Rappaport Luke & Collins Kiel classification Kiel classification/u pdate Working Formulation
REAL Classification NCI 2008 2016 Morphology/ Clinical + Immunohistochemistry
+ Cytogenetics, FISH + Molecular Biology
+ Gene Expression Profiles + Next Generation Sequencing
Classification project-1999
Nebraska
Transcriptomics Genomics
~19 ~25 ~30
University of Nebraska Medical Center
Molecular diagnosis Pathobiology and target characterization Rationalize/Justify the new clinical investigations
expression of a unique set of genes is known as “GENE SIGNATURE
CLP DN1 DN4 DP CD8 CD4 CD8 γδ TFH TH1 T REG HSC CD4 Thymus Periphery Bone Marrow Cytotoxic T TBX21 BCL6 FOXP3 IFN-γ IL4 IL5 IL13 IL21 CXCL13 IL10 TGF-β STAT5 Helper T Cortex Medulla CD4+ CD8+ DN2 DN3 CD44+ CD25- CD44+ CD25+ CD44- CD25+ CD44- CD25- Pre-TCRβ Dependent TCRα Rearrangements TCRβ Rearrangements CD4-CD8- NOTCH IL7 γδ TH2 GATA3 MHC Class I MHC Class II CD24
Complexity of T-cell immunobiology, numerous subsets and functional plasticity makes disease classification challenging
HSC: Hematopoietic stem cells CLP: common lymphoid progenitor
-selection phase repertoire selection phase
adapted from Swerdlow SH et al. Blood 2016 127:2375-2390)
Peripheral T-cell Lymphoma, Not Otherwise Specified PTCL-NOS Anaplastic large-cell lymphoma, ALK(+)ALCL Angioimmunoblastic T-cell lymphoma AITL Follicular PTCL Anaplastic large-cell lymphoma, ALK(-) ALCL
Nodal PTCL with TFH phenotype
PTCL-NOS 30% AITL 22%
ALK-ALCL 7%
ENKTCL 12%
ALK+ ALCL 8%
ATLL 11% HSTL 2% EATL 5%
Others 3%
Park, S. & Ko, Y.H. Int J Hematol (2014) Scott V. Adams et.al J Clin Oncol. 2016; 34: 963–971 Vose et.al J Clin Oncol. 2008, 26:4124–4130
36% France
20% Asia 38% USA
Scott V. Adams et.al J Clin Oncol. 2016 Laurent et.al J Clin Oncol. 2017 Park et. al Int J Hem 2014
Proportion
Test: p<0.001
0.0 0.1 0.2 0.3 0.4 0.5 0.6 0.7 0.8 0.9 1.0 1 2 3 4 5 6 7 8 9 10 11 12 13 14 15 16 17 18 19
Diagnosis Adult T-cell leuk/lymph (ATLL) Anaplastic large cell lymphoma, ALK- Anaplastic large cell lymphoma, ALK+
Angioimmunoblastic T-cell lymphoma Peripheral T-cell lymphoma, NOS
Generic NK-cell
“No Survival Improvement for PTCL/AITL patients over the Past Two Decades: A Population-Based Study of 1207 Cases”
University of Nebraska Medical Center
OS of PTCL-NOS/AITL
Dissecting out
Gene expression profiling: (mRNA expression)
Genetic Evolution of molecular subgroups
Genomic DNA hybridization (DNA copy number variations) Patient-centered Research
Laboratory discoveries Delivery to patient care /communities
Next generation sequencing
Transcriptomics Genomics
University of Nebraska Medical Center
Blood 2010;115:1026-1036
Major entities of PTCL form tight clusters with cases of PTCL-NOS and other rare entities interspersed.
Blood 2010;115:1026-1036
International PTCL Project
AITL ATLL ALK+ALCL
Dendrogram for clustering PTCL-NOS cases using centered correlation and complete linkage CT-PTCL Correlation Other PTCL-U Other PTCL-U
(A) Hierarchal clustering (C) GSEA analysis
IFN responsive genes CD8+ T-cell gene signature P<0.01 P<0.005
(E) Granzyme B expression by immunohistochemistry in CT-PTCL
H & E Granzyme B Proportion
Years Years (D) Survival of the CT-PTCL group
CT-PTCL PTCL-NOS
p=0.05 OS
Proportion CT-PTCL PTCL-NOS
p=0.06 EFS
Hours after stimulation
(B) Expression of the CT-PTCL signature in normal CD8+ T-cells stimulated with anti-CD3, anti-CD28 and IL12 for various time intervals (hours)
CD8+ T-cell 0 2 8 24 48
Blood 2010;115:1026-1036
International peripheral T-cell lymphoma Project
HSTCL
NKCL / -PTCL NK- / T-cell lines CT(α)-PTCL T-cell lines
H &E
TCR-
Markers
Status
CD3
7/7 (+)
CD2
2/4 (+)
CD5
1/7 (+)
CD7
1/1 (+)
CD8
3/5 (+)
CD4
1/6 (+)
CD56
3/4 (+)
TIA1
4/4 (+)
Granzyme B
2/3 (+)
TCR-beta
5/5 (-)
EBER-1
3/5 (-)
OS of PTCL -PTCL have similar gene expression signature as NKCL but distinct from CT(α)- PTCL and HSTCL
Lymphoma and Leukemia Molecular Profiling Project (LLMPP) initiative
Blood 2014
Gene signature/pathway enrichment summary in ALK(-)ALCL
Re-classified from PTCL-NOS
ALK ALK
ALK(+) ALCL ALK(-) ALCL PTCL-NOS
Nat Commun. 2015 Jan 14;6:6025.
into unique PTCL entities
14% 20% n=152 n=117 Infrequent IDH2 mutation 1 of 17 33% IDH2 mutation
₋ AITL ₋ ATLL ₋ ALK(-)ALCL ₋ ALK(+)ALCL ₋ NKCL ₋ -PTCL
Cluster1 Cluster 2 cluster3
GATA3 CCR4
TBX21 CXCR3 STAT1 EOMES 121 PTCL-NOS
(a)
Ig signature
TBX21 (mRNA)
Gata3 (mRNA)
(c) (b)
Years
proportion
GATA3 Unclassifiable TBX21 37 0.9 20 1.41 49 2.08 n median OS (years) Time (years)
Proportion (OS)
p=0.01
(B)
(A)
Probability (LOOCV) TBX21 GATA3 Probability in TBX21 subgroup Probability in GATA3 subgroup
TBX21 Unclassifiable GATA3
(a)
GATA3 TBX21
-catenin oncogenic signature Proliferation MYC targets NF-B target gene signature Plasma cell gene signature INF- gene signature
IHC validation
PI3Kinase regulated Myc induced gene targets (up) Ribosomal transcripts (mTOR) Proliferation related
p=0.2 p=0.05
Quartile
(D)
H&E CD3 TIA1
(B)
TIA1 H&E CD3
(C)
Proportion Time (years) Time (years)
Cytotoxic Pan-B plasma-cell Immunoglobulin
signature
Q1 Q2 Q3 Q4 Q4 Q1+Q2+Q3
OS in TBX21 subgroup OS in TBX21 subgroup
Q1 Q2 Q3 Q4
APC CD4
CD3 CD3 TCR /
JAK2 TYK2
IL-12R
JAK1 JAK2
IFNR
IL12
IFN
MHCII
STAT1 STAT4 TBX21 EOMES
Cellular immunity Inflammation
NOTCH3
DLL1/4
APC CD4
CD3 CD3 TCR/
JAK1 JAK3
IL-2R
JAK1 JAK3
IL4R
IL2
IL4
MHCII
STAT6 STAT5 GATA3 C-MAF
Humoral immunity Abs production
NOTCH 1/2
Jagged1/2
University of Nebraska Medical Center
Proc Natl Acad Sci U S A. 2008 Sep 9; 105(36): 13520–13525.
by distinct genomic abnormalities
PTCL-TBX21
CN Abnormalities Associating with Overall Survival
TP53 CDKN2A MYC
University of Nebraska Medical Center
PTCL-TBX21 AITL
University of Nebraska Medical Center
The complexity of PTCL can finally be addressed with the integration of global genomic analyses, which demonstrated that molecularly defined subgroups of PTCL have diverse genetic features and arise by distinct genetic pathways.
AITL
RHOAG17V IDH2R172 ++ Chr5/21
GC reaction
14q (BCL11B) +Chr 3 gain
Epigenetic Changes Genomic copy number changes
PTCL-GATA3
PTCL-TBX21
CDKN2A-TP53 PTEN-PI3K AMPK-mTOR
University of Nebraska Medical Center
Amador et. al, USCAP 2018 Unpublished
Validation Cohort
n=150 PTCL-NOS
PTCL-NOS subgroups
c c
University of Nebraska Medical Center
Refinement of gene signature algorithm
AITL_3__FFPE_R1
5 10 15 4 8 12
4 8 12 5 10 15
AITL_3__FF_R1
ALCL.neg_2__FFPE_R2
2 6 10 14 5 10 15
5 10 15 2 6 10 14
ALCL.neg_2__FF_R2 ALCL.pos_5__FFPE_R2
5 10 15 5 10 15
5 10 15 5 10 15
ALCL.pos_5__FF_R2 TCL.GATA3_8__FFPE_R
5 10 15 5 10 15
5 10 15 5 10 15
PTCL.GATA3_8__FF_R2 TCL.TBX21_10__FFPE_R
5 10 15 5 10 15
5 10 15 5 10 15
PTCL.TBX21_10__FF_R TCL.TBX21_12__FFPE_R
4 8 12 2 6 10 14
2 6 10 14 4 8 12
PTCL.TBX21_12__FF_R
FFPE RNA FF RNA
100ng of RNA was run for all FF samples
University of Nebraska Medical Center
AITL ALCL PTCL-GATA3 PTCL-TBX21
mRNA code set on nCounter NanoString platform
AITL ALCL PTCL-GATA3 PTCL-TBX21 mRNA diagnostic signature
Digital algorithm Diagnostic signature score PTCL entities FFPE cases Average expression (n= 4 4 6 6 AITL ALCL PTCL-GATA3 PTCL-TBX21
H&E of different organs of a mouse implanted with a primary PTCL-NOS
CNA analysis in PTCL entities Developing PDX models of PTCL-NOS Generating Murine models
KO) in CD4+T-cells induces T- cell proliferation in mice
TCRα TCRβ CD3δ CD3ε CD3ε CD3γ
CD3ζ
CD3ζ
CD28 CD28 CD4/CD8
MHC MHC
Ag
JAK/STAT
Cytokine Receptor Cytokine Receptor Cytokine
SOS GRB2 LAT SLP76
LCK ZAP-70 PI3K AKT mTOR
VAV NCK GADS ITK PLCγ1 IP3 PIP2 RAS DAG MALT1 Bcl10 CARMA1 PKCθ IKKβ IKKγ IKKα TAK1 MKK7 JNK2 NFκB IκB FOS JUN NFκB NFAT IκB Degraded RAF MEK1/2 ERK1/2
Calcium Channel Ca2+ Ca2+ CaM Calcineurin CaMKIV CREB NFAT NFAT
IP3R Intracellular Ca2+ Store MKK3/6 MKK4/7 p38 JNK MEKK1 NFκB Rac/cdc42
PIP3
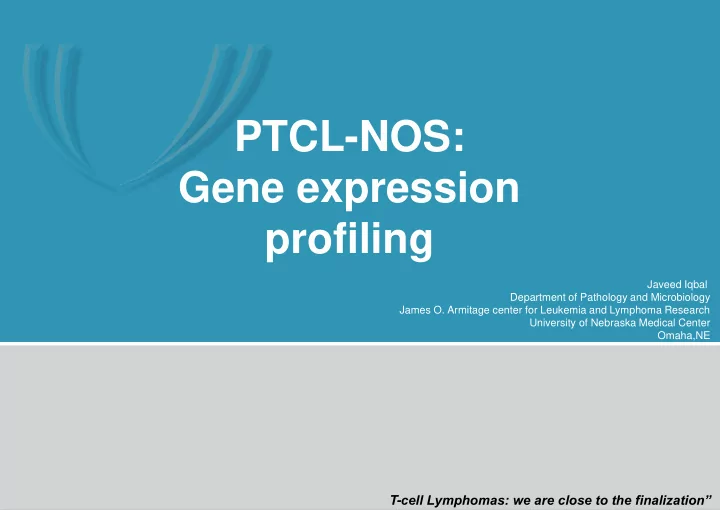
PTCL-NOS GATA3: constitutively active PI3K and mTOR pathways PTCL-NOS TBX21: constitutively active NFκB and STAT3 pathways ALK-ALCL: enriched mTOR pathway signatures ALK-ALCL: constitutively active JAK/STAT3 pathway
NK/T-cell lymphoma: activation of NFκB and JAK/STAT3 pathways
HSTL: high frequency STAT3 mutation Molecularly defined AITL:
and IL-6 signaling identified
Temsirolimus Everolimus Bortezomib Ruxolitinib STAT3
Blood reviews, 2016
Alyssa Bouska Tayla Heavican Waseem Lone Jiayu Yu Catalina Amador Keenan Hartet Sneha R.
Chan Laboratory Wing C. Chan Timothy McKeithan Yuping Liu Pileri Laboratory Stefano Pileri Maria Antonella Laginestra National Cancer Centre Singapore Maarja-Liisa Nairismägi Soon Thye Lim Choon Kiat Ong Weill Cornell Medicine/ Cornell University Giorgio Inghirami Fu Laboratory Kai Fu Andy Bi
Nebraska Medical Center
—John Chan —Dennis Weisenburger —Timothy Mckeithan
— Lou Staudt — George Wright — Elaine S. Jaffe
Nebraska Medical Center Research support
Funding Support
Clinical and Translation Research Program – UNMC Eppley cancer Center Support PTCL-SPORE UH2/UH3 STTR