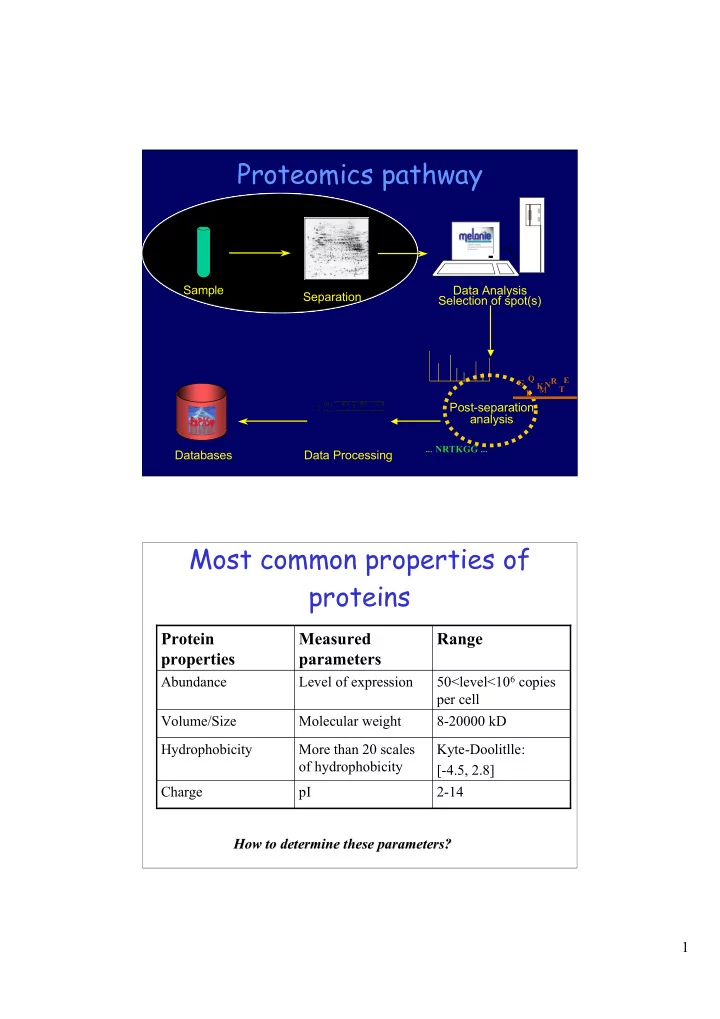
Proteomics pathway Sample Data Analysis Separation Selection of - - PDF document

proteomics pathway
SMART_READER_LITE
LIVE PREVIEW

Proteomics pathway Sample Data Analysis Separation Selection of - - PDF document

Proteomics pathway Sample Data Analysis Separation Selection of spot(s) G Q R E N K T M E Post-separation analysis ... NRTKGG ... Databases Data Processing Most common properties of proteins Protein Measured Range properties


slide-1
SLIDE 1

1

Proteomics pathway

Databases Separation Sample Data Processing Data Analysis Selection of spot(s)

G Q M R T N E K E

... NRTKGG ...

Post-separation analysis

Most common properties of proteins

2-14 pI Charge Kyte-Doolitlle: [-4.5, 2.8] More than 20 scales

  • f hydrophobicity

Hydrophobicity 8-20000 kD Molecular weight Volume/Size 50<level<106 copies per cell Level of expression Abundance

Range Measured parameters Protein properties

How to determine these parameters? How to determine these parameters?

slide-2
SLIDE 2

2

Protein analysis

Samples => Complex proteins mixtures Protein separation before identification procedure Liquid chromatography Electrophoretical separations Gel Capillary pI Mr pI/Mr pI ≈Mr CZE Hydrophobicity Ionic strength Mr

But also: Immuno-selectivity Affinity capture Multidimensional chromatography

Source: Willy Bienvenut

Sample preparation

Objetive Objetive: to allow an efficient separation of the greater number of proteins in two dimensions. This procedure is very important and must This procedure is very important and must: :

  • Solubilise as many proteins as possible including hydrophobic

species

  • Prevent protein aggregates and hydrophobic interactions. This

includes denaturing the proteins to break non-covalent interactions, to break disulfide bonds and to disrupt non-covalent interactions between proteins and other compounds, such as lipids or nucleic acids

  • Remove or digest any RNA or DNA, coenzymes, hormones or

anything else in the cell that could interfere with the proteins separation

slide-3
SLIDE 3

3

Sample preparation (cont.) Sample preparation (cont.)

To overcome some of these problems :  to increase the number of low abundance proteins, two alternative approaches of enrichment of rare polypeptides may be used: Subcellular fractionation and protein prefractionation.  separate membrane proteins, nucleole, cytoplasmic, cytosolics, etc.  Specific reagents to increase solubility of hydrophobic proteins.  Specific reagents to break disulfid bonds.  Enzymatic digestion of DNA and ultracentrifugation.

slide-4
SLIDE 4

4

  • Sub cellular fractionation:

– Differential centrifugation, – Mechanical techniques…

  • Chromatographic approach:

– Ion exchange (cation or anion) – Gel filtration – Affinity

  • Proteins precipitation:

– Acetone, – Ammonium sulfate…

Gel free approach

Sample pre-fractionation

http://www.chem.uwec.edu/Chem352_S03/Pages/Overheads/C352_lect6_view.pdf

slide-5
SLIDE 5

5

  • Separation technique that depends on

differential affinity for a mobile and a stationary phase:

– For protein isolation, the mobile phase is usually an aqueous solution – The stationary phase is attracted to a physical property of the protein:

  • Ion exchange – net charge
  • Reverse phase – hydrophobicity
  • Gel filtration - size
  • Affinity – ligand binding

Chromatography

http://www.chem.uwec.edu/Chem352_S03/Pages/Overheads/C352_lect6_view.pdf

Gel free separation

http://www.chem.uwec.edu/Chem352_S03/Pages/Overheads/C352_lect6_view.pdf

slide-6
SLIDE 6

6

http://www.chem.uwec.edu/Chem352_S03/Pages/Overheads/C352_lect6_view.pdf

Gel-filtration Chromatography

http://www.chem.uwec.edu/Chem352_S03/Pages/Overheads/C352_lect6_view.pdf

Affinity Chromatography

slide-7
SLIDE 7

7

Electrophoresis technique

First dimension First dimension: Anode (+) Cathode (-)

pH 3 10

electric field + + + Basic tampon + sample R - COOH + OH-

R - COO- + H2O

R - NH2 + OH-

R - NH2 + OH-

Cathode (-) Anode (+)

pH 10 3

electric field + + + Acid tampon + sample R - COOH + H3O+

R - COOH + H3O+

R - NH2 + H3O+

R - NH3 + + H2O

First dimension: Isoelectric focusing

slide-8
SLIDE 8

8

2-D PAGE Second dimension

Between first and second dimensions, there is an equilibrium phase necessary to:

  • eliminate products of the initial

gel (ampholytes)

  • resolubilise the proteins and
  • charge the proteins with SDS.

Anode (+) Cathode (-)

Isofocalisation

First dimension Second dimension

SDS-PAGE: molecular weight separation

  • n polyacrylamide gel

See: http://www.rit.edu/~pac8612/electro/Electro_Sim.html

slide-9
SLIDE 9

9

Std Gel A Gel B Std (Mr en KDa) 1 2 3 4 5 6 (Mr en KDa) PHS2 (98 KDa) BSA (65 KDa) OVAL (45 KDa) CAH2 (31 KDa) ITRA (24 KDa) LYC (14 KDa) PHS2 (98 KDa) BSA (65 KDa) OVAL (45 KDa)

Gel A: 12% Acrylamide, Gel B: 8% Acrylamide,

Nucleolar protein separation after coomassie blue staining

10 KDa 120 KDa 30 KDa 150 KDa

http://www.expasy.org/cgi-bin/map2/def?NUCLEOLI_HELA_1D_HUMAN

1-DE separation of proteins (by Mr) 2-DE separation of proteins (by Mr)

Human serum proteins separated by 2-DE, silver stained Human liver proteins separated by 2-DE , silver stained

pH pH

Second dimension = molecular weight (Mw)

slide-10
SLIDE 10

10

IPG with sigmoidal pH

Ecoli Ecoli 3.5 - 10 pH 3.5 - 10 pH 3 - 10 linear rule 3 - 10 linear rule

Final dimensions: 160 x 200 x 1.5 mm, loading capactiy 5 mg of proteins Final dimensions: 160 x 200 x 1.5 mm, loading capactiy 5 mg of proteins

IPG with 1 or 2 pH unities

Swiss 2DPAGE: Swiss 2DPAGE: Ecoli 3.5-10, Ecoli 4-5, Ecoli 4.5-5.5, Ecoli 5-6 Ecoli 3.5-10, Ecoli 4-5, Ecoli 4.5-5.5, Ecoli 5-6 Final dimensions: 160 x 200 x 1.5 mm, loading capactiy 15 mg of proteins Final dimensions: 160 x 200 x 1.5 mm, loading capactiy 15 mg of proteins

slide-11
SLIDE 11

11

Staining

Once separated, the proteins must be detected over the gel to then be called a proteome map. Many different colorants:  Coomassie blue staining  Amido black staining  Silver staining  Fluorescence  Autoradiography ou fluorography

Silver nitrate Commassie blue

Source Dr. Jean-Charles Sanchez, LCCC, Geneva

slide-12
SLIDE 12

12

Analytic 2-D PAGE

Technically, these are the following steps :  Sample preparation  First dimension with IPG  Second dimension with SDS-PAGE  Fixation of proteins on the gel  Proteins detection with staining

Preparative 2-D PAGE

Technically, these are the following steps :  Sample preparation  First dimension with IPG  Second dimension with SDS-PAGE  Transfer to PVDF membrane  Proteins binding on the membrane  Proteins detection with staining over PVDF membrane

slide-13
SLIDE 13

13

Transfer to PVDF membrane

PVDF = Polyvinylidene difluoride membrane Thin as a paper sheet (100 µm):  a more efficient means of storage (proteins are dried).  proteins are even more concentrated.  specially when proteins are designated to sequencing, amino acid composition and mass spectrometry.

Protein identification from gel electrophoresis

Protein in the Gel Electroblotting Protein on the membrane

Image analysis Gel matching Spot cutting for MS analysis Electroelution of the proteins Image analysis Spot cutting for MS analysis & Edman analysis Protein immunodetection AA composition analysis

Willy Bienvenut