
SLIDE 1
1
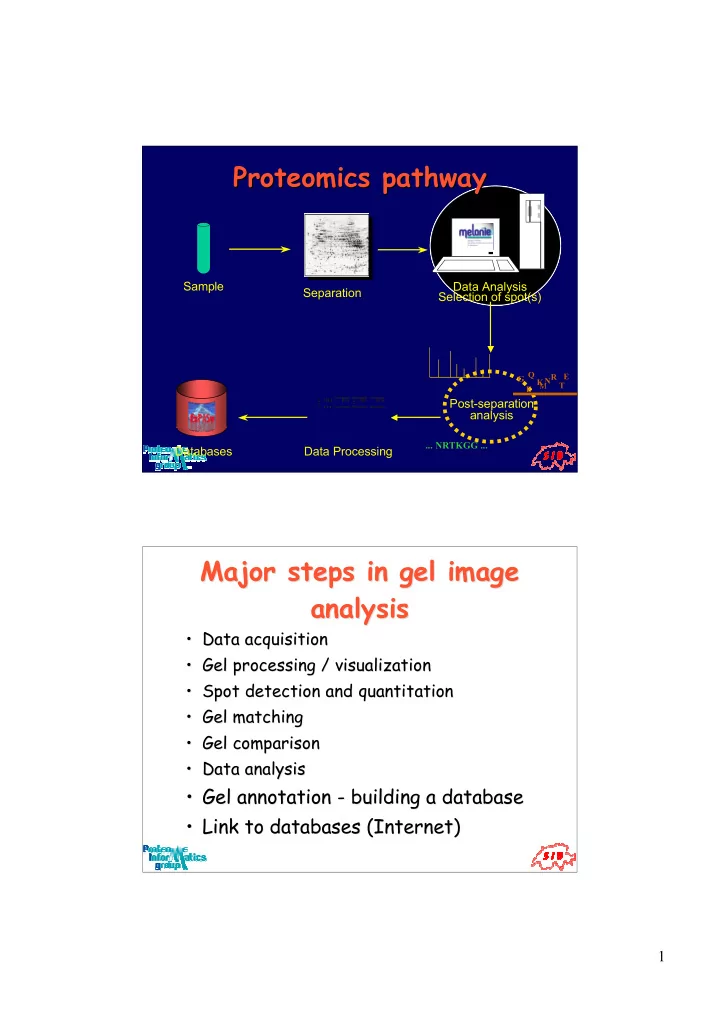
Proteomics pathway Proteomics pathway
Databases Separation Sample Data Processing Data Analysis Selection of spot(s)
G Q M R T N E K E
... NRTKGG ...
Post-separation analysis
Major steps in gel image Major steps in gel image analysis analysis
- Data acquisition
Data acquisition
- Gel processing / visualization
Gel processing / visualization
- Spot detection and
Spot detection and quanti quantit tation ation
- Gel matching
Gel matching
- Gel comparison
Gel comparison
- Data analysis
Data analysis
- Gel annotation - building a database
Gel annotation - building a database
- Link to databases (Internet)