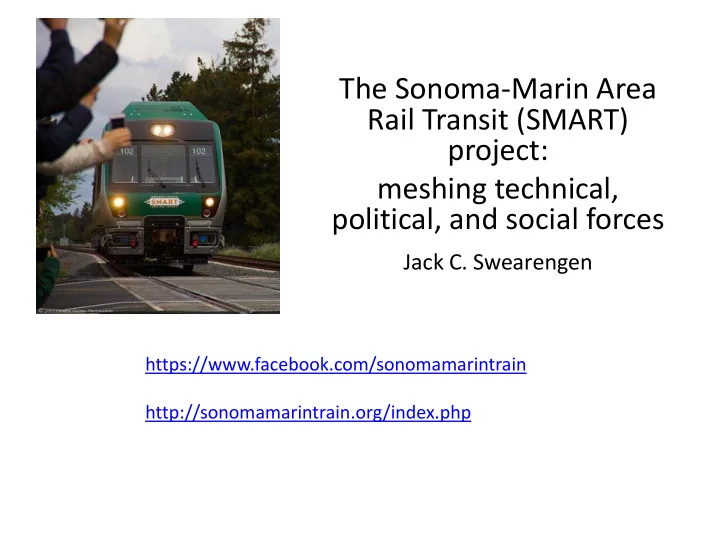
SLIDE 1 The Sonoma-Marin Area Rail Transit (SMART) project: meshing technical, political, and social forces
Jack C. Swearengen
https://www.facebook.com/sonomamarintrain http://sonomamarintrain.org/index.php
SLIDE 2 The Rise of the Nones
Understanding and reaching the religiously unaffiliated
James Emery White (Baker Books 2014)
Nones Cause Community Christ
“Since 2010, cause has proven to be the largest area of connection with a lost world, especially when it comes to the Nones. Cause arrests their attention and enlists their participation in the overall community of Christianity.”
Jeremiah 29:7 (NIV)
Also, seek the peace and prosperity of the city to which I have carried you into
- exile. Pray to the LORD for it, because if it prospers, you too will prosper.”
- Earthkeeping
- Justice: making things right
SLIDE 3 Not just cheerleaders*
- ensure that the project is a social as well as an
engineering success
- be the voice of the community and the
passenger
- serve as a forum and information clearinghouse
- counter opposition and misinformation
* Friends don’t let friends … “
SLIDE 4
SLIDE 5 Ridership studies: where the people live
Each red dot represents 10 people. The vast majority of Marin and Sonoma residents live along the SMART railroad and Highway 101 – most within an easy bike ride to a station. The green dots represent future rail stations along the corridor.
5
SLIDE 6
Ridership studies: where the jobs are
SLIDE 7 Source: D. Sperling. Transportation for Sustainability 7 May 2015
Mobility
The US has evolved into a car monoculture
SLIDE 8 Source: D. Sperling. Transportation for Sustainability 7 May 2015
Their land is full of horses; there is no end to their chariots. Isa 2:7b.
Transportation and the Environment
SLIDE 9 Source: D. Sperling. Transportation for Sustainability 7 May 2015
SLIDE 10 Energy Consumption
Transportation’s share of US energy use is growing…
SLIDE 11
But a shift to rail would make a major impact
SLIDE 12
SLIDE 13 Source: D. Sperling. Transportation for Sustainability 7 May 2015
SLIDE 14
Public transit is a growth industry
SLIDE 15 15
Greenhouse gas reduction
- In Sonoma and Marin Counties, transportation is the source of about
60% of greenhouse gas emissions.
- SMART will directly reduce greenhouse gas emissions by about
124,000 lbs per day, -- 31 million pounds per year -- by shifting an estimated 5,300 daily trips away from automobiles.
- That figure doesn’t include GHG reductions due to increased use of
buses, shuttles, bicycles and walking.
SLIDE 16
Diesel Multiple Unit (DMU)
SLIDE 17
Tier IV Diesel Engine
SLIDE 18 18
SMART’s self-propelled Diesel Multiple Unit (DMU) trains lower greenhouse gas and particulate emissions to unprecedented levels
- Will meet EPA’s stringent Tier 4 emissions standards
- Lower emissions than locomotives
Emissions
SLIDE 19 PHASE I CONSTRUCTION PROGRESS Feb 2015
Construction Start Date May 9, 2012 Started Track Rebuilding July 7, 2012 Total Track Rebuilt 40 miles (out of 43 miles)
- 136,000 crossties replaced (90% concrete)
Passing Sidings Built 3 (out of 4) Bridges/Trestles Rebuilt or Repaired 48 (out of 49)
- 11 timber bridges replaced with concrete
Tunnels Rebuilt 2 Grade Crossings Rebuilt 48 (out of 56) Platform Footings & Walls 10 (out of 12) Systems Ductbank Installation Complete from Airport Blvd. to San Rafael
SLIDE 20 Phase 1 Capital Costs
Construction Contracts $347.8 million Capital Project Management $90.5 million Total $438.3 million
Phase 1 mileage Downtown San Rafael to Santa Rosa Airport 43 mi.
SLIDE 21
Gauntlet tracks
Interlaced tracks, with signals, that allow freight trains to pass station platforms with CPUC- mandated minimum clearance (7 stations)
Level Boarding
SLIDE 22
SLIDE 23
Track Work
Before and after reconstruction
SLIDE 24
Roadway Crossing Inserts
SLIDE 25
Tunnel Rehabilitation (2)
SLIDE 26
New Drawbridge
SLIDE 27 Obstacles surmounted
Economic downturn Unanticipated or underestimated issues, e.g.
- Positive Train Control
- Scope and difficulty of permitting process
- Decline in federal funding for transit
Local opposition including NIMBYs Organized opposition from the highway lobby
SLIDE 28
- Closure
- Grade separation
- Consolidation
- Federal Regulations and State General
Orders
- State, local and industry guidelines
(MUTCD, APTA, and AREMA etc.)
- Road geometry
- Vehicular stopping distance
- Approach (corner) sight distance
up/down track for vehicles approaching crossing
- Clearing sight distance, can the classes
- f vehicles utilizing crossing clear tracks
before
- train enters crossing?
- Train speed
- Type of train service (freight only or
passenger and freight.)
- Road speed
- Road width
- Number of traffic lanes
- Street lights
- Paved or un-paved road?
- Number of passenger trains per day
- Number of freight trains/switch moves
per day
- Number of tracks
- Average daily traffic count
- Total exposure (number of vehicles X
number of trains)
- Type of vehicular traffic (cars, trucks,
trailers, busses etc.)
- Dangerous or hazardous material
traffic?
- Industrial facilities
- Life cycle cost
- Other site specific issues
Private (illegal) Crossings:
Factors to Consider In Diagnostic Engineering Review
SLIDE 29
- Air quality standards
- National Historic Preservation Act Compliance
- Section 4(f) compliance―DOT act of 1966
- Federal Cultural Resource clearances
- Endangered Species Act Compliance
- Executive Order 12898 (Environmental Justice) Compliance
- Title VI of Civil Rights Act
- California Environmental Quality Act
- National Environmental Policy Act
- Cultural Resources Preservation
- Water Quality Study
- Biological Assessment
- State Route 37 Integrated Traffic, Infrastructure and Sea Level Rise Analysis
Some of the hundreds of safety, regulatory, and other steps required
SLIDE 30 Some Agencies that must be satisfied
- Bay Conservation & Development Commission
- Archaeological Construction Monitoring
- State Historic Preservation Office
- US Army Corps of Engineers
- US Coast Guard
- US Fish & Wildlife Service
- National Marine Fisheries Service
- US Department of Transportation
- California Department of Transportation
- Federal Transit Administration
- Federal Railway Administration
- California Public Utilities Commission
- California Department of Fish & Wildlife
- San Francisco Bay Regional Water Quality Control Board
- County flood control districts (2)
SLIDE 31
- Prevent train-to-train collisions
- Prevent overspeed derailments
- Enforce slow zones where workers are present
- At turnouts, PTC will not allow conflicting movements
- At-grade crossing warning systems monitored for
failures
Positive Train Control (PTC)
Mandated by Congress in 2008
Cost to SMART: $50M Three key components: Technology, Safety, Education
SLIDE 32 Surety from PTC
Four levels of redundancy:
- 1. Basic: manual control
- a. speed limits
- b. emergency braking
- 2. Audio & visual warnings to driver
- 3. Automatic train control
- 4. Permission to proceed
Cost: $50M
SLIDE 33
USE OF CREOSOTE TREATED WOOD In the reconstruction of the SMART system, 90% of the existing creosote treated timber ties were removed and replaced with concrete ties. The remaining 10% were replaced with treated timber ties, most located at grade crossings and switches. SMART removed 940 existing creosote treated piles from bridges over Waterways.
SLIDE 34 Chimera coast redwood tree
34
https://www.youtube.com/watch?v=oRylK7auh1I
SLIDE 35 Species & Sensitive Habitat
- CA Red Legged Frog
- CA Clapper Rail
- Salt Marsh Harvest
Mouse
Steelhead
Wetlands
Streams 35
SLIDE 36 Social Justice: SMARTs Title VI Program
- Nondiscrimination Policy
- Outreach & Public
Participation Plan
- Limited English Proficiency
Plan
Standards Policies
Reporting Process.
SLIDE 37
Demographics for Title VI compliance
SLIDE 38 QUIET ZONES
“QUAD GATES”
SLIDE 39 “QUIET ZONES”
Curb median at Hamilton Parkway in Novato
SLIDE 40
Penngrove Crossings
Residents say structures in roadways at SMART tracks, designed as safety feature, pose hazard to motorists
SLIDE 41 Anti-Transit Groups Pro Transit Groups
American Highway Users Alliance
http://www.highways.org/
Alliance for a Paving Moratorium
http://www.culturechange.org/apm_page.htm
Reason Foundation
http://reason.org/areas/topic/t ransportation
American Public Transit Association
http://www.apta.com/Pages/default.aspx
Heartland Institute
https://www.heartland.org/
Victoria Transportation Policy Institute
www.vtpi.org
Cato Institute
http://www.cato.org/
National Alliance of Public Transportation Advocates
http://www.publictransportation.org/napta/Pages/default. aspx
National Motorists Association
http://www.motorists.org
National Association of Railroad Passengers
www.narprail.org
SLIDE 42
- 1. Light Rail has been a failure everywhere. The estimated
costs always prove too low, and the ridership projections are always too high.
- 2. Transit is a declining industry.
- 3. Commuting by rail is slower than commuting by car or bus.
- 4. Transit does not relieve congestion.
- 5. Where transit is needed, buses are better than rail. Buses
cost less and provide the same or better service.
- 6. Rail transit can only serve city centers, but most new jobs
are in the suburbs.
Anti-transit myths
SLIDE 43
- 7. Rail Transit does not spur economic development.
- 8. Transit brings crime into a community.
- 9. Most Light Rail riders are former bus riders.
- 10. Free market competition and privately operated transit
is better.
- 11. On average, most of the seats on a bus or train are
empty.
- 12. It would be cheaper to lease or buy a new car for every
rider than to build a new light rail system.
Anti-transit myths (cont’d)
SLIDE 44
- 1. Transit subsidies exceed automobile subsidies.
- 2. Increasing transit funding does not increase ridership
- 3. Transit is not cost effective.
- 4. Most people do not want rail transit.
- 5. Monorail is better than Light Rail.
- 6. Light Rail is not safe.
- 7. Transit infrastructure is only constructed to get federal money.
- 8. Rail transit does not help revitalize downtowns.
- 9. Transit is an 'inferior' good; as incomes rise, demand declines
- 10. Transit inefficiencies and failures are the result of politics.
More myths
SLIDE 45
- 11. Rail transit is a federal conspiracy.
- 12. Transit is not important because its market share is so
small.
- 13. Transit systems are poor stewards of public funds.
- 14. Rail transit does not increase property values.
- 15. Before federal involvement, transit paid for itself.
- 16. Light Rail is promoted by overly low fares.
- 17. Cutting spending on transit would allow tax cuts.
- 18. Transit subsidies should be directed to users, not
providers.
- 19. Light Rail is social engineering.
- 20. Transit costs more than it should.
- 21. Trains are noisy.
- 22. The overhead wires for Light Rail are ugly.
SLIDE 46 Anti-transit activists must live in denial
- Anthropological global warming is a politically motivated myth, intended
to force us all into smart growth or TOD villages so that we can be controlled.
- Transit is social engineering. (Highways, airports, and subsidies to oil
companies are not social engineering.)
- Public transit undermines individual liberty.
- Traffic congestion can be solved with more pavement.
- Land is an inexhaustible resource.
- Transit is subsidized, whereas highways pay for themselves.
- Petroleum is plentiful, if we just drill (baby, drill).
- Air, soil, and water pollution from cars and trucks is not a cause for
concern (EPA is a cause for concern).
SLIDE 47
First Day of Service