probabilistic estimation of the driver s
play

Probabilistic Estimation of the Drivers Gaze from Head Orientation - PowerPoint PPT Presentation

Probabilistic Estimation of the Drivers Gaze from Head Orientation and Position Sumit Jha and Carlos Busso Multimodal Signal Processing (MSP) Laboratory Department of Electrical Engineering, The University of Texas at Dallas, Richardson


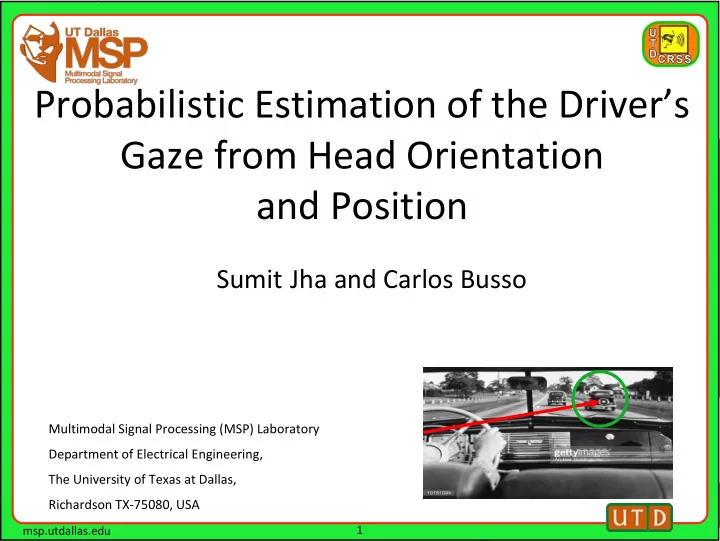
  1. Probabilistic Estimation of the Driver’s Gaze from Head Orientation and Position Sumit Jha and Carlos Busso Multimodal Signal Processing (MSP) Laboratory Department of Electrical Engineering, The University of Texas at Dallas, Richardson TX-75080, USA 1 msp.utdallas.edu

  2. Drivers’ Visual Attention • Primary driving related task • Mirror checking actions [Li and Busso, 2016] • Lane change • Turns and cross sections • Secondary tasks • Mobile phones and in-vehicle entertainment unit • Co-passengers in the car • Billboards and other distractions from the environment Nanxiang Li and Carlos Busso, "Detecting drivers' mirror-checking actions and its application to maneuver and secondary task recognition," IEEE Transactions on Intelligent Transportation Systems 17 (4), 980-992. 2 msp.utdallas.edu

  3. Motivations • Gaze detection challenging in car environment • It is often approximated by head pose • While head pose is strongly correlated with gaze, a one-to-one relation does not exist [Jha and Busso, 2016] Left mirror Right mirror Rear mirror • Goal of this study is to provide a probabilistic prediction of driver’s visual attention from head pose S. Jha and C. Busso. Analyzing the relationship between head pose and gaze to model driver visual attention. In International Conference on Intelligent Transportation Systems (ITSC 2016) , pages 2157 – 2162, Rio de Janeiro, Brazil, November 2016. 3 msp.utdallas.edu

  4. Objective • Head pose – Gaze relation non-deterministic, depends on • Location of gaze • Driver • Use probabilistic model that can provide a distribution of confidence Visual Attention Estimation 4 msp.utdallas.edu

  5. Outline • Dataset • Gaussian Process Regression (GPR) model • Experimental Evaluation • Conclusions 5 msp.utdallas.edu

  6. Data Collection • Relate the head pose to ground truth gaze locations • UTDrive platform • Dash Cameras used instead of the on-board equipment • Blackvue dr650gw 2 channel 6 msp.utdallas.edu

  7. Experimental Setup • Rear camera  Face • Front camera  Road • Markers placed at • windshield (no. 1-13) • mirrors(no. 14-16) • side windows (no. 17-18) • speedometer panel (19), radio (20), and gear (21) • Data collected with 16 subjects (10 males, 6 females) 7 msp.utdallas.edu

  8. Phase 1 (Natural Gaze – Parked Vehicle) • Collected in a parked car • Subject asked to look at each point five times in a random order (21x5 = 105 data per subject) • Natural variability in head pose without the constraint of driving task • The driver familiarizes to the core task 8 msp.utdallas.edu

  9. Phase 2 (Natural Gaze - Driving) • Collected when the subject is driving the car • Subject asked to look at points • Data collected in a straight road with minimum maneuvering task 9 msp.utdallas.edu

  10. AprilTags for Head Pose Estimation • Head pose estimation challenging in driving environment • AprilTags [Olson, 2011] • 2D barcodes that can be robustly detected in an image • Headband designed with 17 AprilTags • Useful for robust detection of head pose across conditions Olson, Edwin. "AprilTag: A robust and flexible visual fiducial system." Robotics and Automation (ICRA), 2011 IEEE International Conference on . IEEE, 2011. 10 msp.utdallas.edu

  11. Outline • Dataset • Gaussian Process Regression (GPR) model • Experimental Evaluation • Conclusions 11 msp.utdallas.edu

  12. Linear Regression Model for Gaze Estimation • linear relationship between Head Pose and Gaze location Orientation Position • 𝑦 0 = 𝑏 0 + 𝑏 1 𝑦 + 𝑏 2 𝑧 + 𝑏 3 𝑨 + 𝑏 4 𝛽 + 𝑏 5 𝛾 + 𝑏 6 𝛿 • R-squared value Phase 1 Phase 2 (Parked) (Driving) Train Test Train Test x 0 0.78 0.77 0.69 0.73 y 0 0.36 0.12 0.36 0.16 z 0 0.25 0.10 0.24 0.12 • High correlation but not enough for a practical gaze prediction from head pose 24 msp.utdallas.edu

  13. Gaussian Process Regression • Get a confidence region instead of a deterministic output • Output assumed to be a Gaussian Process generated from the input variables Deterministic Probabilistic component component The value of the cross covariance is high for close points 13 msp.utdallas.edu

  14. GPR Implementation • Used GPR to model the gaze direction from the head pose • Inputs  Head position (x,y,z) and angles ( α (Yaw) , β (Pitch) and γ (roll) ) • Output  α gaze and β gaze (angle of the vector between the head and the gaze location) • Leave one out cross-validation (LOOCV) – train with 15 subjects and test with the 16 th 14 msp.utdallas.edu

  15. Outline • Dataset • Gaussian Process Regression (GPR) model • Experimental Evaluation • Conclusions 15 msp.utdallas.edu

  16. GPR Performance • Normalized distance of the true gaze location from the predicted distribution • 𝜄 𝑜𝑝𝑠𝑛 = 𝜄 𝑢𝑠𝑣𝑓 − μ 𝑞𝑠𝑓𝑒 𝜏 𝑞𝑠𝑓𝑒 Parked car Driving 16 msp.utdallas.edu

  17. GPR Performance Phase 1 (Parked Car) • Observations • 60% data is concentrated within 50% CI • 95% CI includes 90% gaze target Gaussian Confidence Interval Training Data Test Data 50% region 77.77% 61.34% 75% region 89.45% 78.44% 95% region 96.51% 90.35% 17 msp.utdallas.edu

  18. GPR Performance Phase 2 (Driving) • Observations • Slightly lower performance and generalization • 95% CI includes 89% gaze target Gaussian Confidence Interval Training Data Test Data 50% region 74.5% 56.3% 75% region 88.5% 76.6% 95% region 96.8% 89.4% 18 msp.utdallas.edu

  19. Mapping Region of Gaze on the Windshield • Project the predicted confidence interval of gaze on the windshield • Compare with the ground truth • Small area shows high confidence in prediction of visual attention • Larger area more accurate but low confidence 19 msp.utdallas.edu

  20. Mapping Region of Gaze on the Windshield 20 msp.utdallas.edu

  21. Mapping the Distribution to Road • Distribution obtained at different depth value from the distribution of ɑ and β angles • PDF values for the 3D coordinates summed up for depth values for each Pixel 21 msp.utdallas.edu

  22. Region of Gaze on the Road 22 msp.utdallas.edu

  23. Conclusions and future work • Probabilistic approach to gaze from head pose • Confidence region instead of deterministic regression gives more intuitive results • Future Works • Relate with ground truth on the roads • Road signs • Other cars • Study different types of gaze shifts • Exogeneous shifts – based on external stimuli • Endogenous shifts – based on driver’s intention 23 msp.utdallas.edu

  24. Prospective Applications Info: House no xxxx located Warning: Pedestrians on the Road Arrive at destination Driver Unaware!! 24 msp.utdallas.edu

  25. Thank you! Questions? Info: House no xxxx located Warning: Pedestrians on the Road Arrive at destination Driver Unaware!! msp.utdallas.edu 25 msp.utdallas.edu

Download Presentation
Download Policy: The content available on the website is offered to you 'AS IS' for your personal information and use only. It cannot be commercialized, licensed, or distributed on other websites without prior consent from the author. To download a presentation, simply click this link. If you encounter any difficulties during the download process, it's possible that the publisher has removed the file from their server.

Recommend


More recommend