Probabilistic Data Graham Cormode Antonios Deligiannakis AT&T - - PowerPoint PPT Presentation

probabilistic data
SMART_READER_LITE
LIVE PREVIEW

Probabilistic Data Graham Cormode Antonios Deligiannakis AT&T - - PowerPoint PPT Presentation

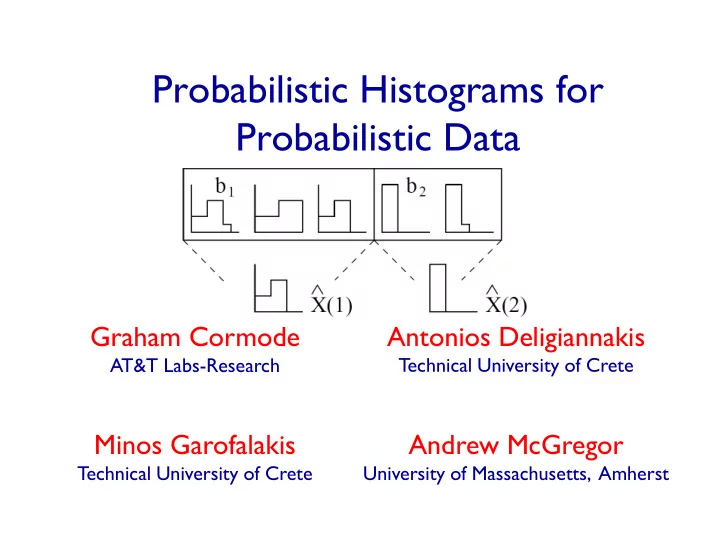
Probabilistic Histograms for Probabilistic Data Graham Cormode Antonios Deligiannakis AT&T Labs-Research Technical University of Crete Minos Garofalakis Andrew McGregor Technical University of Crete University of Massachusetts, Amherst


slide-1
SLIDE 1

Probabilistic Histograms for Probabilistic Data

Graham Cormode

AT&T Labs-Research

Antonios Deligiannakis

Technical University of Crete

Minos Garofalakis

Technical University of Crete

Andrew McGregor

University of Massachusetts, Amherst

slide-2
SLIDE 2

2

Talk Outline

 The need for probabilistic histograms

  • Sources and hardness of probabilistic data
  • Problem definition, interesting metrics

 Proposed Solution  Query Processing Using Probabilistic Histograms

  • Selections, Joins, Aggregation etc

 Experimental study  Conclusions and Future Directions

slide-3
SLIDE 3

3

Sources of Probabilistic Data

 Increasingly data is uncertain and imprecise

  • Data collected from sensors has errors and imprecisions
  • Record linkage has confidence of matches
  • Learning yields probabilistic rules

 Recent efforts to build uncertainty into the DBMS

  • Mystiq, Orion, Trio, MCDB and MayBMS projects
  • Model uncertainty and correlations within tuples
  • Attribute values using probabilistic distribution over mutually

exclusive alternatives

  • Assume independence across tuples
  • Aim to allow general purpose queries over uncertain data
  • Selections, Joins, Aggregations etc
slide-4
SLIDE 4

4

Probabilistic Data Reduction

 Probabilistic data can be difficult to work with

  • Even simple queries can be #P hard *Dalvi, Suciu ’04+
  • joins and projections between (statistically) independent

probabilistic relations

  • need to track the history of generated tuples
  • Want to avoid materializing all possible worlds

 Seek compact representations of probabilistic data

  • Data synopses which capture key properties
  • Can perform expensive operations on compact summaries
slide-5
SLIDE 5

5

Shortcomings of Prior Approaches

 *CG’09+ builds histograms that minimize the

expectation of a given error metric

  • Domain split in buckets
  • Each bucket approximated by a single value

 Too much information lost in this process

  • Expected frequency of an item tells us little about its

probability that it will appear i times

  • How to do joins, or selections based on frequency?

 Not a complete representation scheme

  • Given maximum space, input representation cannot be

fully captured

slide-6
SLIDE 6

6

Our Contribution

 A more powerful representation of uncertain data  Represent each bucket with a PDF

  • Capture prob. of each item appearing i times

 Complete representation  Target several metrics

  • EMD, Kullback-Leibler divergence, Hellinger Distance
  • Max Error, Variation Distance (L1), Sum Squared Error etc
slide-7
SLIDE 7

7

Talk Outline

 The need for probabilistic histograms

  • Sources and hardness of probabilistic data
  • Problem definition, interesting metrics

 Proposed Solution  Query Processing Using Probabilistic Histograms

  • Selections, Joins, Aggregation etc

 Experimental study  Conclusions and Future Directions

slide-8
SLIDE 8

8

Probabilistic Data Model

 Ordered domain U of data items (i.e., ,1, 2, …, N-)  Each item in U obtains values from a value domain V

  • Each with different frequency  each item described by PDF

 Example:

  • PDF of item i describes prob. that i appears 0, 1, 2, … times
  • PDF of item i describes prob. that i measured value V1, V2 etc
slide-9
SLIDE 9

9

Used Representation

 Goal: Participate U domain into buckets  Within each bucket b = (s,e)

  • Approximate (e-s+1) pdfs with a

piece-wise constant PDF X(b)

 Error of above approximation

  • Let d() denote a distance function of PDFs

 Given a space bound, we need to determine

  • number of buckets
  • terms (i.e., pdf complexity) in each bucket

Start: s End: e

  • f bucket

Typically, summation or MAX

slide-10
SLIDE 10

10

Targeted Error Metrics

Variation Distance (L1) Sum Squared Error Max Error (L) (Squared) Hellinger Distance Kullback-Leibler Divergence (relative entropy) Earth Mover’s Distance (EMD) Distance between probabilities at the value domain Common Prob. metrics

slide-11
SLIDE 11

11

General DP Scheme: Inter-Bucket

 Let B-OPTb[w,T] represent error of approximating up to wV

first values of bucket b using T terms

 Let H-OPT[m, T] represent error of first m items in U when

using T terms

Where the last bucket starts Use T-t terms for the first k items Approximate all V+1 frequency values using t terms w Error approximating first w values of PDFS within bucket b Using T terms for bucket b Check all start positions of last bucket, terms to assign

slide-12
SLIDE 12

12

General DP Scheme: Intra-Bucket

 Each bucket b=(s,e) summarizes PDFs of items s,…,e

  • Using from 1 to V=|V | terms

 Let VALERR(b,u,v) denotes minimum possible error of

approximating the frequency values in [u,v] of bucket b. Then:

 Intra-Bucket DP not needed for MAX Error (L) distance

  • Compute efficiently per metric
  • Utilize pre-computations

)} , 1 , ( ] 1 , [ { min ] , [

1 1

w u b VALERR T u OPT B T w OPT B

b w u b

     

  

Where the last term starts Use T-1 terms for the first u frequency values of bucket

slide-13
SLIDE 13

13

Sum Squared Error & (Squared) Hellinger Distance

 Simpler cases (solved similarly). Assume bucket

b=(s,e) and wanting to compute VALERR(b,v,w)

 (Squared) Hellinger Distance (SSE is similar)

  • Represent bucket [s,e]x[v,w] by single value p, where
  • VALERR(b,v,w) =
  • VALERR computed in constant time using O(UV) pre-

computed values, given

Computed by 4 A[ ] entries Computed by 4 B[ ] entries

slide-14
SLIDE 14

 Interesting case, several variations  Best representative within a bucket = median P value   , where  Need to calculate sum of values below median 

two-dimensional range-sum median problem

 Optimal PDF generated is NOT normalized  Normalized PDF produced by scaling = factor of 2

from optimal

 Extensions for ε-error (normalized) approximation

14

Variation Distance

slide-15
SLIDE 15

15

Other Distance Metrics

 Max-Error can be minimized efficiently using

sophisticated pre-computations

  • No Intra-Bucket DP needed
  • Complexity lower than all other metrics: O(TVN2)

 EMD case is more difficult (and costly) to handle  Details in the paper…

slide-16
SLIDE 16

16

Handling Selections and Joins

 Simple statistics such as expectation are simple  Selections on item domain are straightforward

  • Discard irrelevant buckets - Result is itself a prob. histogram

 Selections on the value domain are more challenging

  • Correspond to extracting the distribution conditioned on

selection criteria

 Range predicates are clean: result is a probabilistic

histogram of approximately same size

1 2 3 4 5 X Pr

0.3 0.2 0.1

Pr[X=x | X ≥ 3] 1 2 3 4 5 X Pr

1/2 1/3 1/6

slide-17
SLIDE 17

17

Handling Joins and Aggregates

 Result of joining two probabilistic

relations can be represented by joining their histograms

  • Assume pdfs of each relation are independent
  • Ex: equijoin on V : Form join by taking product
  • f pdfs for each pair of bucket intersections
  • If input histograms have B1, B2 buckets

respectively, the result has at most B1+B2-1 buckets

  • Each bucket has at most: T1+T2-1 terms

 Aggregate queries also supported

  • I.e., count(#tuples) in result
  • Details in the paper…

X Pr X Pr

Join on V

boundaries X Pr

Product of

slide-18
SLIDE 18

18

Experimental Study

 Evaluated on two probabilistic data sets

  • Real data from Mystiq Project (127k tuples, 27,700 items)
  • Synthetic data from MayBMS generator (30K items)

 Competitive technique considered: IDEAL-1TERM

  • One bucket per EACH item (i.e., no space bound)
  • A single term per bucket

 Investigated:

  • Scalability of PHist for each metric
  • Error compared to IDEAL-1TERM
slide-19
SLIDE 19

19

Quality of Probabilistic Histograms

 Clear benefit when compared to IDEAL-1TERM

  • PHist able to approximate full distribution
slide-20
SLIDE 20

20

Scalability

  • Time cost is linear in T, quadratic in N
  • Variation Distance (almost cubic complexity in N) scales poorly
  • Observe “knee” in right figure. Cost of buckets with > V terms is

same as with EXACTLY V terms => INNER DP uses already computed costs

slide-21
SLIDE 21

21

Concluding Remarks

 Presented techniques for building probabilistic

histograms over probabilistic data

  • Capture full distribution of data items, not just expectations
  • Support several minimization metrics
  • Resulting histograms can handle selection, join, aggregation

queries

 Future Work

  • Current model assumes independence of items. Seek

extensions where this assumption does not hold

  • Running time improvements
  • (1+ε)-approximate solutions [Guha, Koudas, Shim: ACM TODS 2006]
  • Prune search space (i.e., very large buckets) using lower bounds for

bucket costs