SLIDE 1
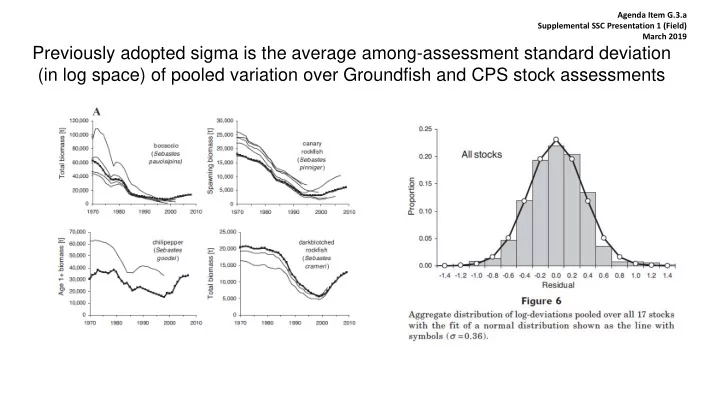
Previously adopted sigma is the average among-assessment standard deviation (in log space) of pooled variation over Groundfish and CPS stock assessments
Agenda Item G.3.a Supplemental SSC Presentation 1 (Field) March 2019
SLIDE 2
σ = 0.36 σ = 0.72 σ = 1.44
2010 sigma was 0.36, the combination of that and the policy decision of what probability of overfishing to allow determined the actual buffer fraction Uncertainty for Tier-2 and Tier-3 stocks was doubled and quadrupled, respectively
SLIDE 3
Step 1: Update 2010 analysis Key differences- forecast rather than hindcast, error in OFL rather than spawning output, and include recruitment variability. 2010 sigma: 0.357 Update sigma: 0.389 Sensitivity sigma: 0.342 Projection-based approach (OFL) Historical biomass approach Resulting baseline sigma = 0.439 * (0.389/0.342) = 0.50
SLIDE 4
Step 2: Account for increased uncertainty with assessment age Based on the divergence of model biomass projections derived from base model and low state of nature in decision table Result is linear increase of 0.075 in sigma each year
SLIDE 5
Category 1 σ Category 2 σ Category 3 σ Year Old New Old New Old New 1 0.36 0.50 0.72 1.0 1.44 2.00 2 0.36 0.5375 0.72 1.075 1.44 2.00 3 0.36 0.575 0.72 1.15 1.44 2.00 4 0.36 0.6125 0.72 1.225 1.44 2.00 5 0.36 0.65 0.72 1.30 1.44 2.00 6 0.36 0.6875 0.72 1.375 1.44 2.00 7 0.36 0.725 0.72 1.45 1.44 2.00 8 0.36 0.7625 0.72 1.525 1.44 2.00 9 0.36 0.80 0.72 1.60 1.44 2.00 10 0.36 0.8375 0.72 1.675 1.44 2.00
Table 2. A comparison of the old and new sigma values for category 1, 2, and 3 groundfish and CPS stocks
.
SLIDE 6
Table 3. A comparison of the old and new scientific uncertainty reductions for P* = 0.45.
.
P*=0.45 Category 1 Category 2 Category 3
Year Old New Old New Old New 1 4.4% 6.1% 8.7% 11.8% 16.6% 22.2% 2 4.4% 6.5% 8.7% 12.6% 16.6% 22.2% 3 4.4% 7.0% 8.7% 13.5% 16.6% 22.2% 4 4.4% 7.4% 8.7% 14.3% 16.6% 22.2% 5 4.4% 7.8% 8.7% 15.1% 16.6% 22.2% 6 4.4% 8.3% 8.7% 15.9% 16.6% 22.2% 7 4.4% 8.7% 8.7% 16.7% 16.6% 22.2% 8 4.4% 9.1% 8.7% 17.4% 16.6% 22.2% 9 4.4% 9.6% 8.7% 18.2% 16.6% 22.2% 10 4.4% 10.0% 8.7% 19.0% 16.6% 22.2%