SLIDE 1
Production NVH Test Tools and Methods
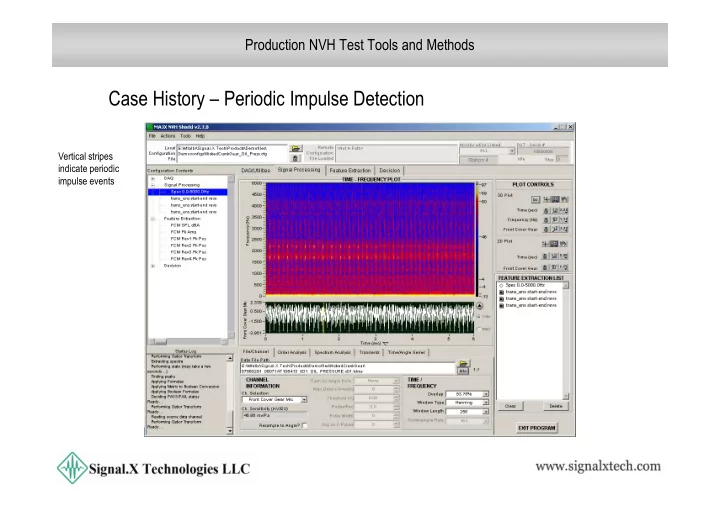
Case History – Periodic Impulse Detection
Vertical stripes indicate periodic impulse events
SLIDE 2
Production NVH Test Tools and Methods
Case History – Periodic Impulse Detection
Re-sample the file relative to a reference shaft using 500 orders (1000 pts per rev)
SLIDE 3
Production NVH Test Tools and Methods
Case History – Periodic Impulse Detection
4 Rev Frames stacked into a frame ensemble and viewed top-down form a matrix A column-wise variance statistic indicates periodic impulse
SLIDE 4
Production NVH Test Tools and Methods
Case History – Periodic Impulse Detection
The impulse indicator shows angular position of recurring impulse events that are periodic A metric representing the maximum will define the severity of the impulsive event
SLIDE 5
Production NVH Test Tools and Methods
Case History – Periodic Impulse Detection
The metric is added to the overall Decision matrix All metrics in the table are computed and tested simultaneously
SLIDE 6
Production NVH Test Tools and Methods
Case History – Periodic Impulse Detection
Classification of the periodic impulse is a requirement
SLIDE 7
Production NVH Test Tools and Methods
Case History – Periodic Impulse Detection
4Revs will show a repeating impulse pattern that can be quantified by the relative distance in revs of each impulse event
SLIDE 8 Production NVH Test Tools and Methods
Case History – Periodic Impulse Detection
Qualifying peaks above a threshold produce a metric that returns the position
SLIDE 9
Production NVH Test Tools and Methods
Case History – Periodic Impulse Detection
A Formula metric is defined that will report the distance between peaks Rev 3 position – Rev 1 position will equal 2 if this a 1/cycle impulse in the first rotation of the shaft Rev 4 position – Rev 2 position will equal 2 if this a 1/cycle impulse in the second rotation of the shaft Subtract 2 to make the metric = 0 if a periodic impulse in the correct rotation is detected
SLIDE 10
Production NVH Test Tools and Methods
Case History – Periodic Impulse Detection
If a formula metric is = 0, then a periodic impulse is found at the correct interval and position and the Boolean is TRUE A Boolean metric is created by testing the numeric formula result
SLIDE 11
Production NVH Test Tools and Methods
Case History – Periodic Impulse Detection
On the Decision table, classification is simple and intuitive A 1/cyle impulse of sufficient amplitude was found A Boolean formula combines two booleans into a single result
SLIDE 12
Production NVH Test Tools and Methods
Case History – Periodic Impulse Detection
FCM Pk Amp The new metric is applied to 20,000 engines from 4 identical test stands stored in the historical database Metric refinement and expected pass/fail rates are studied before taking this to production