
SLIDE 1
1 | Presentation Title | Presenter Name | Date | Subject | Business Use Only
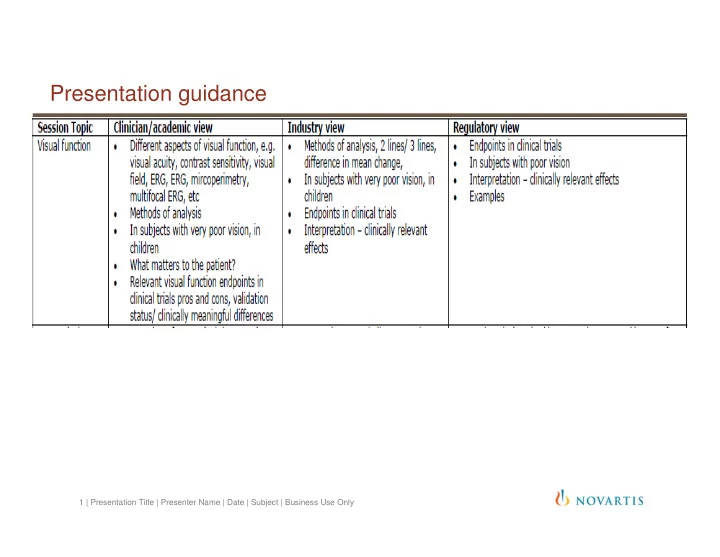
Presentation guidance 1 | Presentation Title | Presenter Name | Date - - PowerPoint PPT Presentation
Presentation guidance 1 | Presentation Title | Presenter Name | Date | Subject | Business Use Only Visual function endpoints Industry view Dr. Gabriela Burian Global Program Medical Director Novartis Pharma AG Basel, Switzerland Topics
1 | Presentation Title | Presenter Name | Date | Subject | Business Use Only
* Focus of presentation on Visual Acuity (VA), as a key measure of macular visual
Acuity (BCVA) using standard Early Treatment of Diabetic Retinopathy Study (ETDRS)-like charts of patients` examination.
vision function, peripheral vision, sharpness)
treatment
=> at individual patient level
=> an overall favorable, positive benefit/risk profile of a treatment better than current therapy
diseases and healthcare burdens)
Efficacy outcomes: primarily analysed the ``avoidance of VA loss``: proportion (%)
loss (i.e. ± 5 letters) The outcome benefit: evaluated at a pre- determined primary/secondary timepoint compared to baseline, i.e. 12/24 months
An average outcome of >50% patients avoiding loss was considered clinically relevant compared to natural progression
Efficacy outcomes: primarily analysing the ``VA gain``: mean VA change, proportion (%) of subjects with ``gain >0, 5,10, 15 letters``
(Brown et al., N Engl J Med 2006)
The outcome benefit evaluated at a primary/secondary timepoint compared to baseline (12/24 months), but also overtime (change over time) An average outcome of avoidance of VA loss is no longer considered a relevant benefit (>90% of patients can avoid loss of >15 letters) when compared to previous therapies VA gain has become the clinically relevant outcome
A natural and efficient summary measure for a continuous variable as the VA score (Csaky et al.,
IOVS 2008)
Difference in mean VA change between compared treatments: on average of 10-20 letters (2-4 lines)
Difference between treatments: on average 2-3 fold
Brown et al., N Engl J Med 2006
Evaluates the benefit outcome over the entire observation period with: the variability between visits the onset of benefit immediately after treatment initiation
Massin et al., Diabetes Care 2010 Mitchell et al., Ophthalmol 2011
(Falkenstein et al., Ophthalmol 2008)
Visual acuity (VA) Improvement in VA: Mean VA change at time Mean average VA change over time % VA gain >0, >5, >10, >15 letters % with VA >20/40 at time x Snellen or other VA charts in clinical practice Contrast sensitivity (CS) Improvement in CS Pelli-Robson charts not sufficiently standardised and calibrated, subjective Reading performance
Subjective, good technician/ reproducible methodoloy to achieve desired outcomes Macular edema (Central retinal thickness, CRT, volume, CRV) Reduction of edema: Mean CRT change Excess reduction Function (BCVA)-anatomy (CRT) correlation not demonstrated; but new technology + testing edema as predictor of future VA loss. Evaluate photoreceptors health and amount of healthy retina. Patient-reported visual function (VFQ-25) Increase in VFQ-25 score Correlation of VA gain w improvement in VFQ-25 scores in macular diseases; utility as measures of function loss (Cusick et
al., AJO 2005; Mangione et al., Arch Ophthalmol 2001)
Csaky et al., IOVS 2008
Massin et al. Diabetes Care 2010. Mitchell et al. Ophthalmol 2011.
Ophthalmol 2001) A gain of 10 or more letters leads to an increase in the composite NEI-VFQ-25 scores by an amount judged to be clinically significant in diseases of the macula (Bressler et al., Arch Ophthalmol 2009; Chang et al., Arch Ophthalmol 2007; Mangione et al. 2001)
For example:
15
Integrity of IS/OS
Above RPE Below RPE Cysts Intra/sub- retinal fluid Integrity of RPE/MB
individual patients is challenging
assess the overall benefit achieved in individual patients
average study population that translates significantly at the individual patient level needs further evaluation