
SLIDE 1
Present Status of Neutron Source at J PARC MLF Katsuhiro Haga On - - PowerPoint PPT Presentation
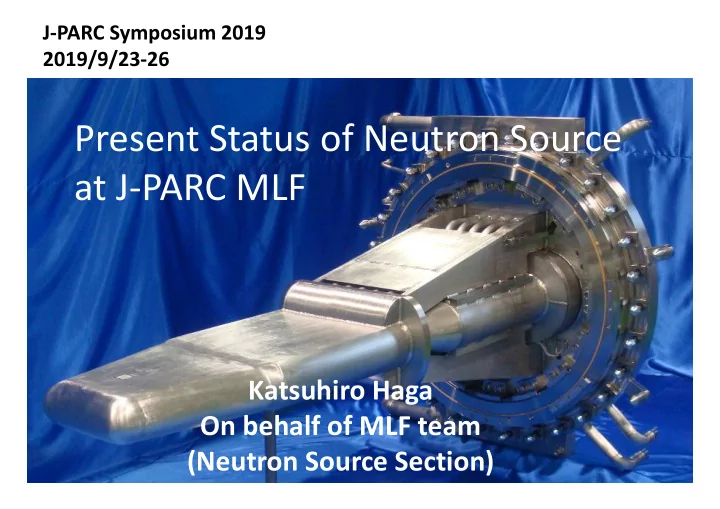
J PARC Symposium 2019 2019/9/23 26 Present Status of Neutron Source at J PARC MLF Katsuhiro Haga On behalf of MLF team (Neutron Source Section) 1 MW spallation neutron source at J PARC Cryogenic hydrogen system Moderators
Cryogenic hydrogen system Proton beam 3 GeV, 1MW, 25 Hz Neutron beam lines (23) 21: in operation Mercury target system
Moderators
2
Year
2008 2009 2010 2011 2012 2013 2014 2015 2016 2017 2018 2019 #1 #2 #3 #4 #5 #6 #7 #8 #9 120 ~ 310 kW, 2050 MWh 330 ~ 513 kW, 670 MWh Failure in outer water shroud 210 ~ 150 kW, 1048 MWh
20 ~ 220 kW, 471 MWh 6 times target replacements to date 300 ~ 525 kW, 1812 MWh 300 ~ 535 kW, 2120 MWh
Improved robust design
Failure in inner water shroud
3
4
10 20 30 40 50 60 70 80 90 100 100 200 300 400 500 600 700 800 900 1000 Oct Nov Dec Jan Feb Mar Apr May Jun Jul Aug Sep Oct Nov Dec Jan Feb Mar Apr May Jun Jul
Beam Power [kW] Operational Efficiency [%]
1MW study (1 hour) 2018 2019
5
1MW study (10.5 hour)
Target #8
Beam power
Target #9
Summer shutdown (target replacement) Average operational efficiency per run#
10 20 30 40 50 60 200 400 600 800 1000 Temperature rise of mercury vessel, ℃ Beam power, kW 5 10 15 20 25 30 200 400 600 800 1000 Temperature rise of mercury, ℃ Beam power, kW
Mercury Mercury temperature Mercury vessel temperature
Heat deposition of 50%
mercury was assumed. Temperature riser of mercury showed good agreement with the analytical prediction. Temperature rise of mercury vessel at 1 MW was a little bit less than the analytical prediction. The effect of beam profile can be one of the reasons.
Proton beam
20 40 60 80 100 120 200 400 600 800 1000
11:00 13:00 15:00 17:00 19:00 21:00
Temperature trend at 1MW study
Mercury vessel Mercury at outlet Mercury at inlet Beam power
Analytical prediction Analytical prediction 1MW Study
Study data of #9 target Study data of #8 target
1MW study
Temperature [ºC] Beam power [kW] Temperatures reached almost stable values in two hours.
Facility data of steady state under 1 MW beam condition could be obtained for the first time.
7
1050mm
3mm Diffusion bonding Water channels End plate
1st~7th (previous)
constraint‐free
High robustness and reliability can be obtained.
Made with diffusion bonding and many welds which can be the cause of initial defects. Monolithic structure
Hg vessel Monolithic structure of water shroud Water shroud Bolts Hg vessel Water shroud Hg vessel Water shroud Hg vessel
Constraints between vessels cause high thermal stress which limits beam power.
No coupling between vessels. Fabrication techniques were improved.
Welds were drastically reduced. 8
9
Mercury vessel Water shroud He layer(Gap:3mm)
By the high accuracy fabrication and welding techniques with little deformation, the 3 mm gap of helium layer could be maintained. By the intensified non‐destructive inspection, tiny defects can be detected in the fabrication process to minimize the possibility of target failure during the beam operation. The constraint‐free type target is ready to be used from this November.
Suppression of welding deformation is the key issue. Water shroud Reinforcement rib Back plate Back plate Dial gauges
Fabricated with the combination of TIG welding and Electron Beam welding.
Pulsed proton beam Mercury vessel Pitting damage of the wall by the cavitation Actual pitting damages Beam window (Thickness : 3 mm)
Most vulnerable to pitting damage
#1 SNS target 3055 MWh Mercury Abrupt heating
Pressure wave Thermal expansion Φ 50 mm #1 J‐PARC target 471 MWh
0.25 mm
(D. McClintock, JNM 2012)
Schematic images of pitting damage generation
Mercury Wall Cavitation bubble
Cavitation bubble inflates by the mercury negative pressure. Cavitation bubble shrinks rapidly. Shrink energy concentrates to one point and damage is formed.
Micro‐jet
Proton beam
Mercury
Rapid flow in narrow channel Micro‐bubble injection Outer wall
P
2mm Inner wall
50 mm
Stagnant 250μm Flow
A:Center of thermal shock B:Propagation path
Absorption of thermal expansion of mercury by bubble contraction Attenuation of pressure waves by thermal dissipation of kinetic energy
Proton beam Bubbler
Mirror
Laser Doppler Vibrometer(LDV)
Target vessel
Microphone
0.1 0.2 0.3 0.4 2 4 6 8 10 12 14
Time, ms
w/o bubbles
Proton beam : 300 kW
w/ bubbles
Displacement velocity, m/s
0.2 0.4 0.6 0.8 1 20 40 60 80 100 Velocity amplitude, m/s PQ
0.5 1 1.5 200 400 600 800 1000
Beam power [kW]
Normalized peak value of sound signal
Vibration of target vessel #8
Study data in the past 1MW study data Analytical prediction
P, Q and vibration velocity amplitude are related well by the parameter PQ. The parameter showed good agreement with the analytical prediction. P: beam power Q: heat density , : constant
Sound signal of target vessel
Data of target #9 Data of target #8 Because of inadequate welding, Mirror dropped
pressure wave vibration. Efficacy of bubble injection was monitored by sound signal recorded by a microphone. The sound data showed good linearity and agreement between #8 and #9 targets.
13
Target No. 8 (Oct. 2017 — Jul. 2018) Total energy : 1812 MWh
Total pulses : ca. 3.76×10⁸ shots
70 mm
Cut two locations (center and off‐center)
Mercury vessel Water shroud
4 layers window (3+3+3+5 mm)
Center Off‐center
Hole saw
φ50 mm
Beam ① Outer wall inside ③ Inner wall inside ② Inner wall
Center Off‐center
① Outer wall inside ③Inner wall inside (Bulk side) (Narrow channel) Center Off‐center
Dose rate: ~200 Sv/h
②Inner wall outside
Damage on the narrow channel side was much less than that on the bulk side, which is
advantageous to protect the outer wall, i.e. mercury boundary.
No‐visible damages were observed on the off‐center specimens. Soundness of the inner wall is also important since damage penetration through the
inner wall from the bulk side would hamper the damage mitigation effect in the narrow channel. Dmax: ~15 µm Dmax: ~250 µm
15
Electrode diameter: 1 mm
Stagnant Flowing
Cavitation bubble
Microjet Microjet Narrow gap Microjet 200 kfps 200 kfps 200 kfps 200 kfps
Flow velocity and gap width dependency (confirmed)
Power dependency of cavitation damage in narrow channel has not clarified yet.
through experiments and numerical simulation
‐‐‐wall curvature on flow pattern ‐‐‐cross flow for bubble distribution, bubble coalescence in narrow channel, etc.
Pump Surge tank Nozzles for tracer bubbles Flow meter Rectangular and curvature test section Flow meter Compressor
High-speed video camera Acrylic channel(70x70) Cross flow test section
Curvature model Curvature model Rectangular model
Bubbles for tracer Camera
Water Experiment
Mercury flow velocity Mercury temperature Helium bubble particle flow trace : 80 μm [m/s] [deg C] Bubbler position of current target Mercury vessel temperature [deg C]
JFY 2016 JFY 2017 JFY 2018 JFY 2019 JFY 2020 100 200 300 400 500 600 700 800 900
1000
MLF beam power (kW)
#2 (200 kW)
#2 (150 kW)
#8 (300 ~ 500 kW)
1‐MW test
Lifetime estimation based on pitting damage observation Operation
Further development of pitting‐damage mitigation‐technology will be continued for high power stable target operation. #9 (> 500 kW)
1‐MW test
Constraint free type target
19