
SLIDE 1
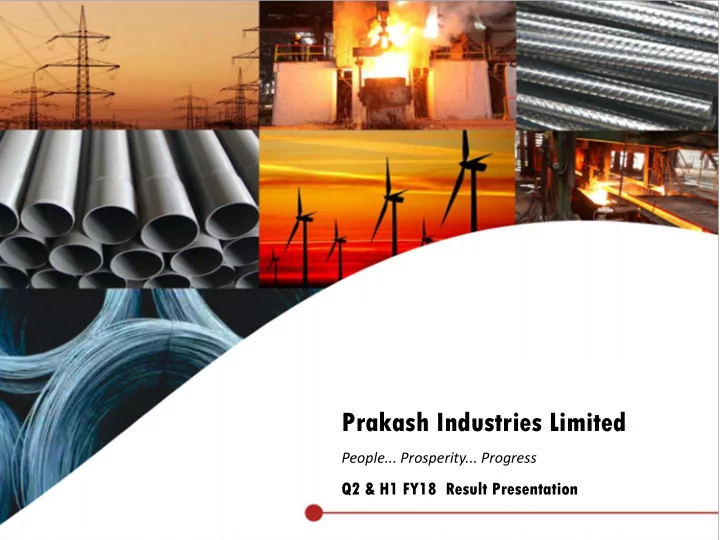
Prakash Industries Limited
People... Prosperity... Progress
Prakash Industries Limited People... Prosperity... Progress Q2 - - PowerPoint PPT Presentation
Prakash Industries Limited People... Prosperity... Progress Q2 & H1 FY18 Result Presentation Disclaimer This presentation and the accompanying slides (the Presentation), which have been prepared by Prakash Industries Limited (the
People... Prosperity... Progress
This presentation and the accompanying slides (the “Presentation”), which have been prepared by Prakash Industries Limited (the “Company”) solely for information purposes and do not constitute any offer, recommendation or invitation to purchase or subscribe for any securities, and shall not form the basis or be relied on in connection with any contract
statutory offering document containing detailed information about the Company. This Presentation has been prepared by the Company based on information and data which the Company considers reliable, but the Company makes no representation or warranty, express or implied, whatsoever, and no reliance shall be placed on, the truth, accuracy, completeness, fairness and reasonableness of the contents of this Presentation. This Presentation may not be all inclusive and may not contain all of the information that you may consider material. Any liability in respect of the contents of, or any omission from, this Presentation is expressly excluded. Certain matters discussed in this Presentation may contain statements regarding the Company’s market opportunity and business prospects that are individually and collectively forward-looking statements. Such forward-looking statements are not guarantees of future performance and are subject to known and unknown risks, uncertainties and assumptions that are difficult to predict. These risks and uncertainties include, but are not limited to, the performance
and world-wide, competition, the company’s ability to successfully implement its strategy, the Company’s future levels
flows, the Company’s market preferences and its exposure to market risks, as well as other risks. The Company’s actual results, levels of activity, performance or achievements could differ materially and adversely from results expressed in
contained in this Presentation. Any forward-looking statements and projections made by third parties included in this Presentation are not adopted by the Company and the Company is not responsible for such third party statements and projections.
2
3
4
5
Revenue (Rs. Cr)
+29% YoY 501 648 Q2FY17* Q2FY18 57 124 Q2FY17 Q2FY18 14 65 Q2FY17 Q2FY18 +118% YoY +376% YoY
EBITDA (Rs. Cr) PAT (Rs. Cr)
* Revenue for Q2FY17 adjusted as per GST
6
Revenue (Rs. Cr)
+15% YoY 1,195 1,370 H1FY17 H1FY18 114 234 H1FY17 H1FY18 27 124 H1FY17 H1FY18 +106% YoY +361% YoY
EBITDA (Rs. Cr) PAT (Rs. Cr)
Expansion in Sponge Iron & Power Co-generation capacity
Secured Additional Long Term Coal Linkages
Expansion in PVC Pipes Capacity
Demerger of PVC Pipes Business
submitted to SEBI and Stock Exchanges
equity shares held in the Company
7
Allotment of Equity shares to FCCB holders
exercised by certain FCCB holders
Rs 152.51 Cr Reduction in debt liability on account of conversion of FCCBs into Equity Shares and repayment of Term Loans
been converted
8
9
Q2FY18 Q2FY17 YoY H1FY18 H1FY17 YoY FY17 Revenues 648 556 16% 1,370 1,195 15% 2,415 Other Income 5.5 1.2 6.8 1.7 3.3 Total Income 653 558 17% 1,377 1,197 15% 2,418 Raw Material 413 343 832 754 1,482 Employee Expenses 43 38 90 76 155 Other Operating Expenses 73 119 221 254 517 EBITDA 124 57 118% 234 114 106% 265 EBITDA Margin (%) 19.2% 10.2% 17.0% 9.5% 10.9% Depreciation 31 26 59 51 103 Interest 22 17 42 34 73 Profit Before Tax 71 15 389% 133 29 365% 88 Tax 5
Net Profit 66 15 353% 125 29 338% 81 Net Profit Margin (%) 10.1% 2.6% 9.1% 2.4% 3.3% Other Comprehensive income (1) (1) (1) (2) (3) Total Comprehensive Income 65 14 376% 124 27 361% 78
Sep-17 Mar-17 Non-current assets 3,114 3,093 Fixed assets 2,840 2,771 Non Current Tax Asset 3 3 Other non-current assets 272 319 Current Assets 442 409 Investments 33
176 188 Trade receivables 92 76 Cash & Cash equivalents 11 17 Bank Balance (other then Cash equivalents) 35 11 Other Current Assets 95 117 Total Assets 3,556 3,503
10
Sep-17 Mar-17 Shareholder’s Funds 2,398 2,221 Share capital 153 139 Other Equity 2,245 2,082 Non-current liabilities 607 694 Long term borrowings 483 578 Long-Term Provisions 32 29 Deferred tax liability 92 87 Current liabilities 551 588 Short Term Borrowings 99 143 Trade Payables 109 97 Other Financial Liabilities 252 265 Short-term provisions 14 13 Other Current liabilities 48 51 Deferred tax liability 28 19 Total Equities & Liabilities 3,556 3,503 Key Balance Sheet Ratios FY17 Gross Debt to Equity 0.35x Fixed Asset Coverage Ratio 5.7x Working Capital Days 25 Days
11
12
13
14
Product Location Existing Capacity Sponge Iron Champa, Chhattisgarh 1.0 Mn Tons Steel Billets Champa, Chhattisgarh 1.1 Mn Tons Ferro Alloys Champa, Chhattisgarh 0.1 Mn Tons Finished Steel (Wire Rods, TMT Bars, Structural) Raipur, Chhattisgarh 1.1 Mn Tons
Fully Integrated steel plant at Chhattisgarh Produces steel through coal based Sponge Iron Route ; Technical collaboration with Lugri GmbH, Germany Secured Supply of Key Raw material – (i) Iron Ore through allotted mines in the state of
Chhattisgarh & Odisha (ii) Coal through long term linkage from Coal India
15
16
Operating 230 MW captive power at its Integrated Steel Plant Power generated partly by harnessing waste gases emanating from Sponge Iron process and partly through Thermal route Newly commenced Fifth Sponge Iron Rotary Kiln generating additional 15MW power
17
National Steel Policy 2017
capacity of 300 MT by 2030-31
steel, electrical steel, special steels and alloys for strategic applications by 2030-31
production by 2030-31
products
Focus on Affordable Housing & Infrastructure
5 years
completion timeline to 5 years from 3 years
housing Projects
– Railways – Defence – Roadways – Inland Waterways – Metros – Ports – Airports
Plant Strategically located in Uttrakhand; with current capacity of 55,000 MTPA Strong Brand presence in the states of UP, Uttrakhand, Delhi, Haryana & Punjab Witnessing Revenue Growth of 16% CAGR in last 5 years Operating profit margin growth at 26% CAGR since last 5 years Enhanced product portfolio with PVC fittings and Garden Pipes
20
Government thrust on Agriculture & Infrastructure Swachh Bharat Abhiyan “Affordable Housing” and “Housing for All” Higher Union Budget allocation for Irrigation sector GST to give edge to the organised players over unorganised sector
Product Location Existing Capacity Future Capacity Total Capacity Time Line Integrated Steel Finished Steel Raipur, Chhattisgarh 1.1 Mn Tons
Champa, Chhattisgarh 1.0 Mn Tons 0.20 Mn Tons 1.2 Mn Tons Sept, 2018 Steel Billets Champa, Chhattisgarh 1.1 Mn Tons
Champa, Chhattisgarh 0.13 Mn Tons
Champa, Chattisgarh 230 MW 15 MW 245 MW Sept, 2018 PVC Pipes Kashipur, Uttarakhand 55,000 Tons Phase I – 10,000 Tons 65,000 Tons Mar, 2018 Phase II – 45,000 Tons 1,10,000 Tons Sep, 2019
21
22
For more information visit: www.prakash.com