
SLIDE 1
Practical Odour assessm ent Nigel Gibson Odour - the problem The - - PDF document
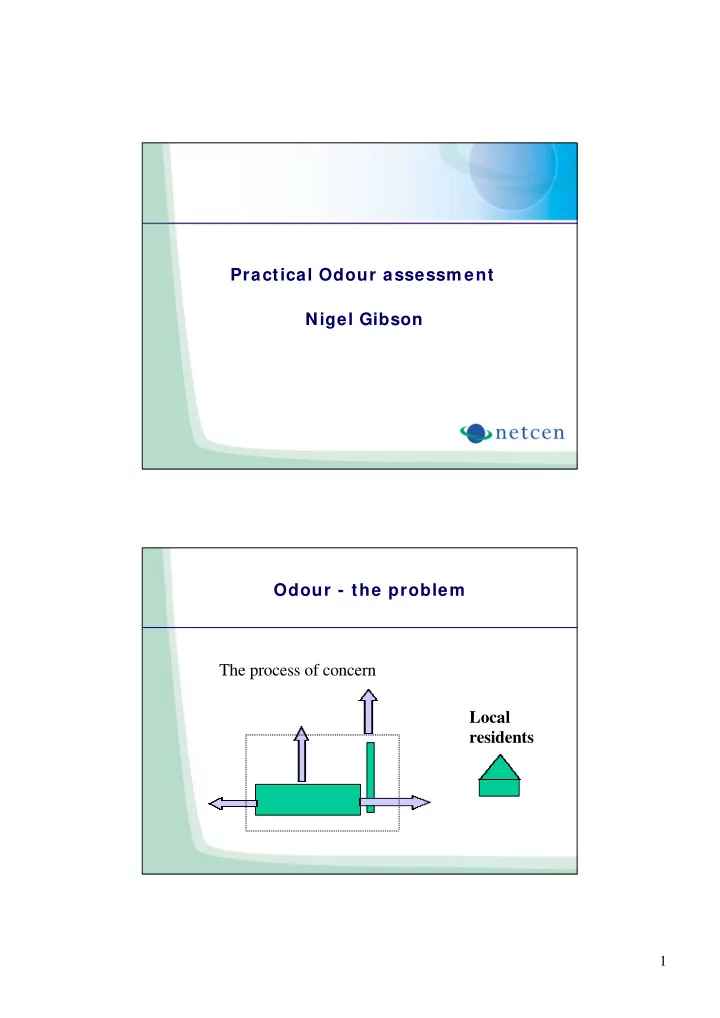
Practical Odour assessm ent Nigel Gibson Odour - the problem The process of concern Local residents 1 Topics covered Complaints Off-site survey Odour/ odorant sampling Odour/ odorant measurement Odour assessment
complants year 1 9 / 1 / 9 8 2 3 / 1 / 9 8 6 / 2 / 9 8 2 / 2 / 9 8 6 / 3 / 9 8 2 / 3 / 9 8 3 / 4 / 9 8 1 7 / 4 / 9 8 1 / 5 / 9 8 1 5 / 5 / 9 8 2 9 / 5 / 9 8 1 2 / 6 / 9 8 2 6 / 6 / 9 8 1 / 7 / 9 8 2 4 / 7 / 9 8 7 / 8 / 9 8 2 1 / 8 / 9 8 4 / 9 / 9 8 1 8 / 9 / 9 8 2 / 1 / 9 8 1 6 / 1 / 9 8 3 / 1 / 9 8 1 3 / 1 1 / 9 8 2 7 / 1 1 / 9 8 date complaint days complants
complaints 2 / 1 / 9 9 3 / 2 / 9 9 1 7 / 2 / 9 9 3 / 3 / 9 9 1 7 / 3 / 9 9 3 1 / 3 / 9 9 1 4 / 4 / 9 9 2 8 / 4 / 9 9 1 2 / 5 / 9 9 2 6 / 5 / 9 9 9 / 6 / 9 9 2 3 / 6 / 9 9 7 / 7 / 9 9 2 1 / 7 / 9 9 4 / 8 / 9 9 1 8 / 8 / 9 9 1 / 9 / 9 9 1 5 / 9 / 9 9 2 9 / 9 / 9 9 1 3 / 1 / 9 9 2 7 / 1 / 9 9 1 / 1 1 / 9 9 2 4 / 1 1 / 9 9 8 / 1 2 / 9 9 month complaint day complaints
Figure 4 odour control parameters v complaints
5 10 15 20 25 30 35 40 45 21/05/98 26/05/98 31/05/98 05/06/98 10/06/98 15/06/98 20/06/98 25/06/98 30/06/98 day bed temp. (deg C) 1 2 3 4 5 6 7 8 9 10 pH bed temperature complaints mex temp bed pH acidic pH
Figure1 showing wind speed, direction and complaints in June 1998
0.0 90.0 180.0 270.0 360.0 3600 3624 3648 3670 3694 3718 3742 3766 3790 3814 3838 3862 3886 3910 3934 3958 3982 4006 4030 4054 4078 4102 4126 4150 4174 4198 4222 4246 4270 4294 4318 4342 4366 Hour Wind direction (degrees from north) 0.0 2.0 4.0 6.0 8.0 10.0 12.0 14.0 windspeed (m/s) winddirection complaints WIND SPEED
Figure 1 Odour and H2S concentrations throughout one kiln cycle
0.E+00 5.E+05 1.E+06 2.E+06 2.E+06 3.E+06 3.E+06 4.E+06 4.E+06 5.E+06 5.E+06 6 : 1 8 7 : 2 8 : 1 5 9 : 1 4 1 : 1 3 1 1 : 1 3 1 2 : 1 4 1 3 : 1 4 1 4 : 1 6 1 5 : 1 6 1 6 : 1 5 1 7 : 1 7 1 8 : 1 6 1 9 : 1 5 2 : 1 7 2 1 : 1 5 time Odour concentration (ou/m3) 0.5 1 1.5 2 2.5 3 3.5 time H2S concentration (ppm) tot odour tot h2s
348000.00 348400.00 348800.00 349200.00 349600.00 350000.00 461000.00 461200.00 461400.00 461600.00 461800.00 462000.00 462200.00 462400.00 462600.00 462800.00 463000.00