
Power Systems Modeling: Common Methodologies to Address Fuel, CO 2 and Water Needs Chris Nichols Office of Strategic Energy Analysis and Planning Presented at the 37 th IAEE US DOE, National Energy Technology Laboratory International Conference Peter Kobos (Sandia National Lab), Chuck Zelek New York City, NY & Tim Grant (NETL) June 17 th , 2014 National Energy Sandia National Laboratories is a multi-program laboratory managed and operated by Sandia Corporation, a wholly owned Technology Laboratory subsidiary of Lockheed Martin Corporation, for the U.S. Department of Energy’s National Nuclear Security Administration under contract DE-AC04-94AL85000.
Overview • This paper compares select scenarios and results from models which have differing scopes but have the capability of analyzing the impacts of some or all portions of the CO 2 capture, transport and storage process – found even though the models used different methodologies and scopes there were still key conclusions that the models shared 2
Key takeaways • Proximity of a CO 2 sink to a source was not the primary motivator for the optimal storage site, but quality and size of the storage formation was more important – Even at mileage differences of around 125 miles, reservoirs with the more favorable geology were preferred • At the national level, around 5 reservoirs served most of the CO 2 storage needs of the entire nation – Large pipeline networks constructed by the models to move CO 2 to the best storage sites • Importance of small, less favorable reservoirs should not be discounted – provide an important “surge volume” since remaining CO 2 is stored in these formations when the larger, more favorable ones are full 3
Methodology • Models used: – NETL: • CO 2 Saline Storage Cost Model (SSCM) for storage site cost analysis; • Capture Transport Utilization and Storage (CTUS) model for characterization of capture, transport, EOR utilization of CO 2 • MARKet ALlocation (MARKAL) modeling platform – Sandia: • Water, Energy and Carbon Sequestration Model (WECSsim TM ) • Ran a regional case with SSCM and WECSsim and a national case with MARKAL+CTUS and WECSsim – Compared results across the modeling platforms 4
Regional results from SSCM Mt. Simon formations are more favorable for CO 2 storage than the Rose Run formation Two hypothetical plant sites were selected. Total CCS costs were cheaper for the Mt. Simon formations in every case until the plant was moved east of Rose Run. 5
Regional results from WECSim • WECSsim regional results compared storage options for captured CO 2 from the A B Brown power plant in Indiana at the Mt. Simon (61 miles away) and St. Peter (140 miles) formations Inject CO 2 and Extract & Treat H 2 O Inject CO 2 only (Mt. Simon [St. Peter]) (Mt. Simon [St. Peter]) CCS Cost 59.5 [62.5] 58 [57.5] ($/tonne) 76.5 [75.9] Avoided Cost, saline extract & 78.5 [82.4] treat ($/tonne avoided) Added Energy Cost for CCS 5.97 [5.87] 6.21 [6.15] (cents/kWh) Added Energy Cost for water 0.54 [0.81] 0 [0] related (cents/kWh) Marginal Cost of CO 2 transport 0.02 [0.04] X [1.87] (cents/kWh) Total CCS cost is cheaper for the more distant formation 6
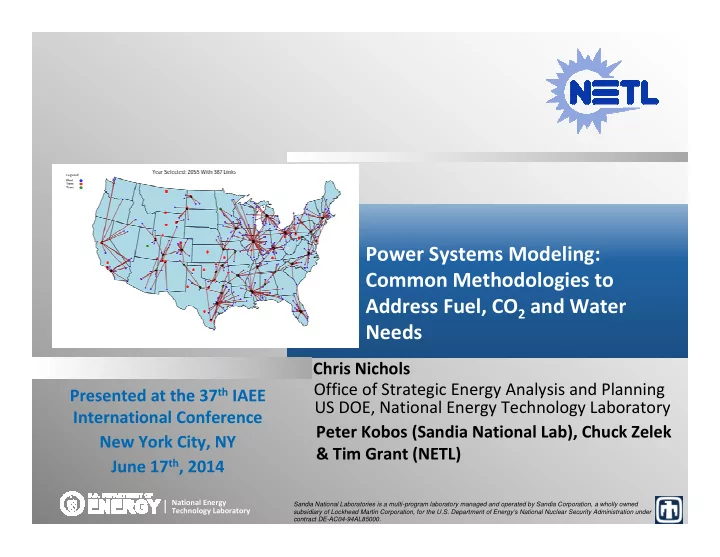
National-level: MARKAL+CTUS results Using CCS deployments from a MARKAL run, the CTUS model was used to forecast the transportation and storage of the CO 2 captured. A nation-wide CO 2 pipeline network was constructed to move CO 2 to the best formations 7
National-level: WECSsim results A similar distribution of sources sending their CO 2 to the best storage sites, but with a large number of smaller, closer sites being utilized as the big ones fill up 8
Conclusions • Closer is not necessarily better when it comes to CO 2 storage sites – Costs of storage outweigh transport for most power plant to reservoir configurations • Pareto Principle applies for utilization of storage formations – Well under 20% of storage formations will likely store over 80% of CO 2 captured • Still important to characterize and understand storage in the smaller, less favorable formations – Since extra CO 2 can’t be vented when large reservoirs fill up, there must be places to put it 9
Acknowledgements • This was a joint intra- and inter-lab effort: – Christopher J. Nichols, National Energy Technology Laboratory (SEAP) – Peter H. Kobos, Sandia National Laboratories – Chuck Zelek & Tim Grant, National Energy Technology Laboratory (OPPA) 10
Recommend
More recommend