
SLIDE 1
(c) IRD 2004 1
Power System Restoration - The Graceful Degradation Phase
Mike Adibi, IRD Corporation Bethesda, Maryland, USA madibird@aol.com
(c) IRD 2004 2
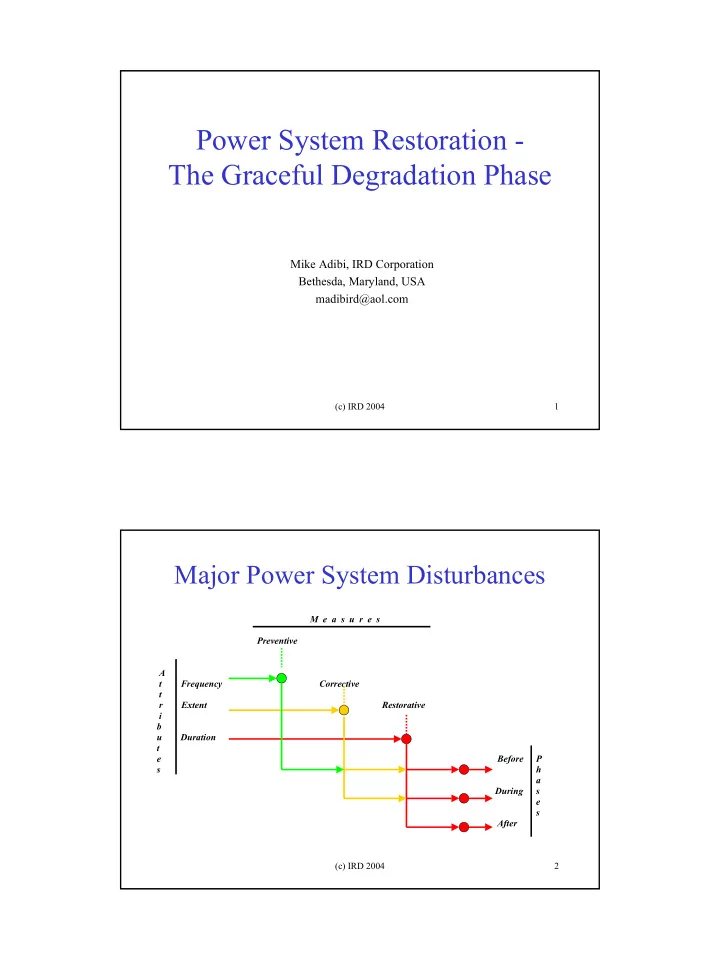
Major Power System Disturbances
M e a s u r e s Preventive A t Frequency Corrective t r Extent Restorative i b u Duration t e Before P s h a During s e s After