
SLIDE 1
Post-fire Forest Regeneration in the California’s National Forests
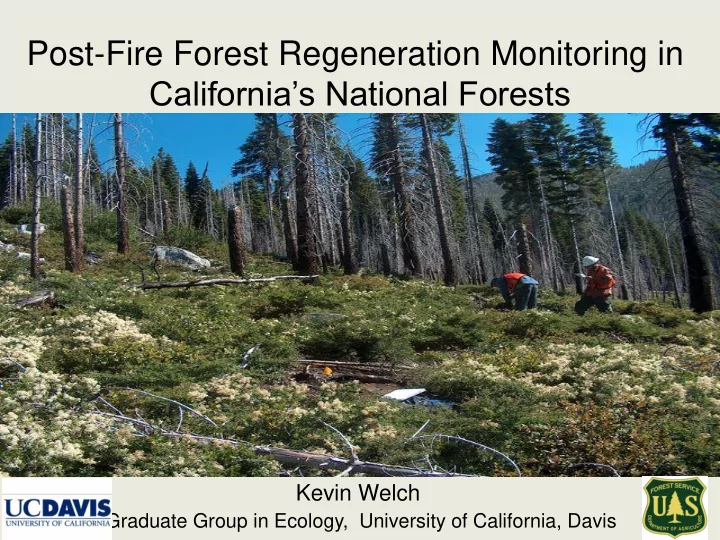
Post-Fire Forest Regeneration Monitoring in California’s National Forests
Kevin Welch Graduate Group in Ecology, University of California, Davis
Post-fire Forest Regeneration in the California s National Forests - - PowerPoint PPT Presentation
Post-Fire Forest Regeneration Monitoring in Californias National Forests Post-fire Forest Regeneration in the California s National Forests Kevin Welch Graduate Group in Ecology, University of California, Davis Wildfire on National
Kevin Welch Graduate Group in Ecology, University of California, Davis
2009 )
spatial heterogeneity. In particular, low to mid-severity fires (PSW-GTR-220 2009) What are the impacts of fire on forest recovery? Increase in fire frequency & severity
(Miller et al. 2009)
detail across a wide variety of low- and mid- elevation fires of similar age
rates, accounting for differences in topography, fire intensity, and spatially explicit variables.
Simulator models.
effectively applying scarce restoration funds
My Research Questions
is limiting tree seedling abundancies across a range of fire severities?
fire disturbance? Do conifers have a numerical advantage over hardwoods in the early stages of revegetation in the post-fire environment? Future question:
interannual climate variation? And how might these year effects be mitigated through time?
LANDSAT pixel is assigned a fire severity class, using the relative dNBR (Miller & Thode, 2007)
conifer/hardwo
200m grid is
represent a 10- acre sample point (660 ft interval, and 4 ha sample)
Tahoe National Forest
Fire Severity total # of plots 22 1 14 2 14 3 15 4 21 5 42
2011 Field Season
Table 1: Sampled Fires
Fire National Forest Year acres burned Year sampled Plots installed
Deep Sequoia 2004 3,164 2009 24 Fred’s El Dorado 2004 7,471 2009 121 Power El Dorado 2004 16,979 2009 155 Straylor Lassen 2004 3,333 2009 62 Showers Lake Tahoe Basin 2002 325 2009 17 Spanish Mendocino 2003 6313 2010 145 Sims Shasta-Trinity & Six Rivers 2004 3901 2010 88 Pendola Tahoe & Plumas 1999 12,295 2010-11 180 Harding Tahoe 2005 2291 2010 67 Bar Shasta-Trinity 2006 101,652 2011 90 Bassetts Tahoe 2006 2,600 2011 128 Ralston Tahoe & El Dorado 2006 8,593 2011 94 Total: 168,917 1,171
Natural Regeneration by Species
* -
fire severity class
11-12 years after the fire, TNF & PNF
Why this shape? Possible factors:
potential seed tree
lack of safe microsites and favorable micro- climatic conditions
Distance to Seed Tree
Classification and regression trees revealed that in most fires, distance to potential seed tree was the most influential predictor of regeneration
Distance to Seed Tree
– – – Figure 24: conifer density (seedlings/acre) by distance to con seed tree (ft) – Ralston Fire
p=0.03
Figure 25: hardwood density (seedlings/acre) by distance to hardwd seed tree (ft) – Ralston Fire
p=0.01
Ralston Fire
Effects of shrub cover on conifer seedling density
Freds Fire P = .01 Power Fire p = .02
p=0.03 Conifer Growth Rate vs. Shrub Cover - Bar Fire p=.02 Conifer Height vs. Shrub Cover - Bar Fire depends on species and life history traits too
Hardwoods
note: hardwood resprouts are plotted against a 2nd vertical axis (resprouts/acre).
Natural Regeneration by Type & Resprouting Hardwoods
fire severity class
Power Fire
fire severity class
Sims Fire
p=.01 p=.55
Mean Maximum Heights (ft) of Woody Vegetation Ralston Fire
between fire severity and natural regeneration rates, with a peak in low severity class 2 and consistently declining to class 5
driving regeneration patterns
seedling production in the first 5-7 years. Does this change through time with the competition of hardwood resprouts?
seedling density
consequent years are all important factors
regeneration trends and models
term succession, climate change effects)
practices
thinning?
We would like to thank the United States Forest Service for providing funding for this project, and in particular, Hugh Safford, Mike Landram and Joe Sherlock for their assistance in the background analysis. A special appreciation goes to Chris Carlson (Univ. of Montana) for his insight, wit and training. And, of course, none of these data would have been collected without the tenacious field crew: Bill Stewart, Gabrielle Bohlman, Bliss Lee, Taylor Farnum, Vicki Alla, Clark Richter, Marcel Safford, Chris Preston, and Tara Roth.