SLIDE 1
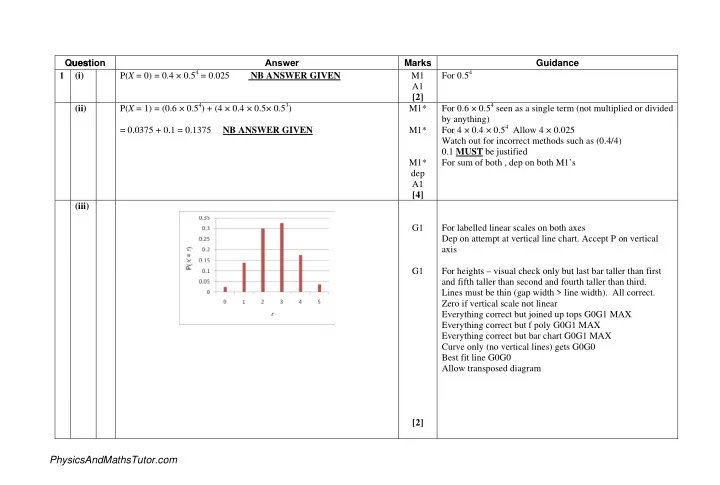
Question uest Answer Marks Guidance 1 (i) P(X = 0) = 0.4 × 0.54 = 0.025 NB ANSWER GIVEN M1 For 0.54 A1 [2] (ii) M1* P(X = 1) = (0.6 × 0.54) + (4 × 0.4 × 0.5× 0.53) = 0.0375 + 0.1 = 0.1375 NB ANSWER GIVEN M1* M1* dep For 0.6 × 0.54 seen as a single term (not multiplied or divided by anything) For 4 × 0.4 × 0.54 Allow 4 × 0.025 Watch out for incorrect methods such as (0.4/4) 0.1 MUST be justified For sum of both , dep on both M1’s A1 [4] (iii) G1 G1 For labelled linear scales on both axes Dep on attempt at vertical line chart. Accept P on vertical axis For heights – visual check only but last bar taller than first and fifth taller than second and fourth taller than third. Lines must be thin (gap width > line width). All correct. Zero if vertical scale not linear Everything correct but joined up tops G0G1 MAX Everything correct but f poly G0G1 MAX Everything correct but bar chart G0G1 MAX Curve only (no vertical lines) gets G0G0 Best fit line G0G0 Allow transposed diagram [2]
PhysicsAndMathsTutor.com
SLIDE 2
Question uest Answer Marks Guidance 1 (iv) ‘Negative’ or ‘very slight negative’ E1 [1] E0 for symmetrical but E1 for (very slight) negative skewness even if also mention symmetrical Ignore any reference to unimodal (v) M1 A1 M1* E(X) = (0×0.025) + (1×0.1375) + (2×0.3) + (3×0.325) + (4×0.175) + (5×0.0375) = 2.6 E(X2) = (0×0.025) + (1×0.1375) + (4×0.3) + (9×0.325) + 16×0.175) + (25×0.0 75) = 0 + 0.1375 + 1.2 + 2.925 + 2.8 + 0.9375 = 8 Var (X) = 8 – 2.62 M1* dep = 1.24 A1 [5] For Σrp (at least 3 terms correct) CAO For Σr2p (at least 3 terms correct) for – their E( X )² FT their E(X) provided Var( X ) > 0 USE of E(X-µ)2 gets M1 for attempt at (x-µ)2 should see (- 2.6)2, (-1.6)2, (-0.6)2, 0.42, 1.42, 2.42 (if E(X) correct but FT their E(X)) (all 5 correct for M1), then M1 for Σp(x-µ)2 (at least 3 terms correct) Division by 5 or other spurious value at end gives max M1A1M1M1A0, or M1A0M1M1A0 if E(X) also divided by 5. Unsupported correct answers get 5 marks. (vi) M1 M1 P(Total of 3) = (3×0.325×0.0252) + (6×0.3×0.1375×0.025) + 0.13753 = 3 × 0.000203 + 6 × 0.001031 + 0.002600= 0.000609 + 0.006188 + 0.002600 = 0.00940 (= 3×13/64000 + 6×33/32000 + 1331/512000) M1 A1 For decimal part of first term 0.325×0.0252 For decimal part of second term 0.3×0.1375×0.025 For third term – ignore extra coefficient All M marks above depend on triple probability products CAO: AWRT 0.0094. Allow 0.009 with working. [4]
PhysicsAndMathsTutor.com
SLIDE 3 2 (i) Median = 2 Mode = 1 B1 CAO B1 CAO 2 (ii)
10 20 30 40 50 60 1 4 2 3
Number of P eople
S1 labelled linear scales on both axes H1 heights 2 (iii) Positive B1 1 TOTAL 5
PhysicsAndMathsTutor.com
SLIDE 4 3 (i) Positive B1 1 (ii) Number of people = 20 × 33 ( 000) + 5 × 58 (000 ) = 660 ( 000 ) + 290 (000) = 950 000 M1 first term M1(indep) second term A1 cao
NB answer of 950 scores M2A0
3 (iii) (A) a = 1810 + 340 = 2150 (B) Median = age of 1 385 (000th ) person or 1385.5 (000) Age 30, cf = 1 240 (000); age 40, cf = 1 810 (000) Estimate median = (30) + 570
145 × 10
Median = 32.5 years (32.54...) If no working shown then 32.54 or
better is needed to gain the M1A1. If 32.5 seen with no previous working allow SC1
M1 for sum A1 cao 2150 or 2150 thousand but not 215000 B1 for 1 385 (000) or 1385.5 M1 for attempt to interpolate
k k 570 145 × 10
(2.54 or better suggests this) A1 cao min 1dp 2 3 (iv) Frequency densities: 56, 65, 77, 59, 45, 17
(accept 45.33 and 17.43 for 45 and 17)
B1 for any one correct B1 for all correct
(soi by listing or from histogram)
Note: all G marks below dep on attempt at frequency density, NOT frequency G1 Linear scales on both axes (no inequalities) G1 Heights FT their listed fds or all must be
All blocks joined G1 Appropriate label for vertical scale eg ‘Frequency density (thousands)’, ‘frequency (thousands) per 10 years’, ‘thousands of people per 10 years’. (allow key). OR f.d. 5
PhysicsAndMathsTutor.com
SLIDE 5
(v) Any two suitable comments such as: Outer London has a greater proportion (or %) of people under 20 (or almost equal proportion) The modal group in Inner London is 20-30 but in Outer London it is 30-40 Outer London has a greater proportion (14%) of aged 65+ All populations in each age group are higher in Outer London Outer London has a more evenly spread distribution or balanced distribution (ages) o.e. E1 E1 2 (vi) Mean increase ↑ median unchanged (-) midrange increase ↑ standard deviation increase ↑ interquartile range unchanged. ( - ) Any one correct B1 Any two correct B2 Any three correct B3 All five correct B4 4 TOTAL 20
PhysicsAndMathsTutor.com